



USDJPY Bulls Getting Uneasy on Anniversary of Last Years Flash Crash
There are technical signs that USD/JPY is vulnerable to breaking down
Share this:

Traders are filtering back to their desks, but the market is unlikely to fully recover from it’s low-volume holiday lull until next week.
In particular, Japanese markets are closed through the rest of the week for a 4-day bank holiday. That shiver that some readers just felt run down their spine is perfectly understandable: FX traders will recall the “flash crash” in the Japanese yen, when the currency surged 3-5% against its major rivals in a matter of minutes, over the same low-liquidity period last year. Analysts are still trying to explain the causes of that move, but the takeaway is that trading aggressively through this week carries more risk (and arguably less reward) than during a more typical market environment.
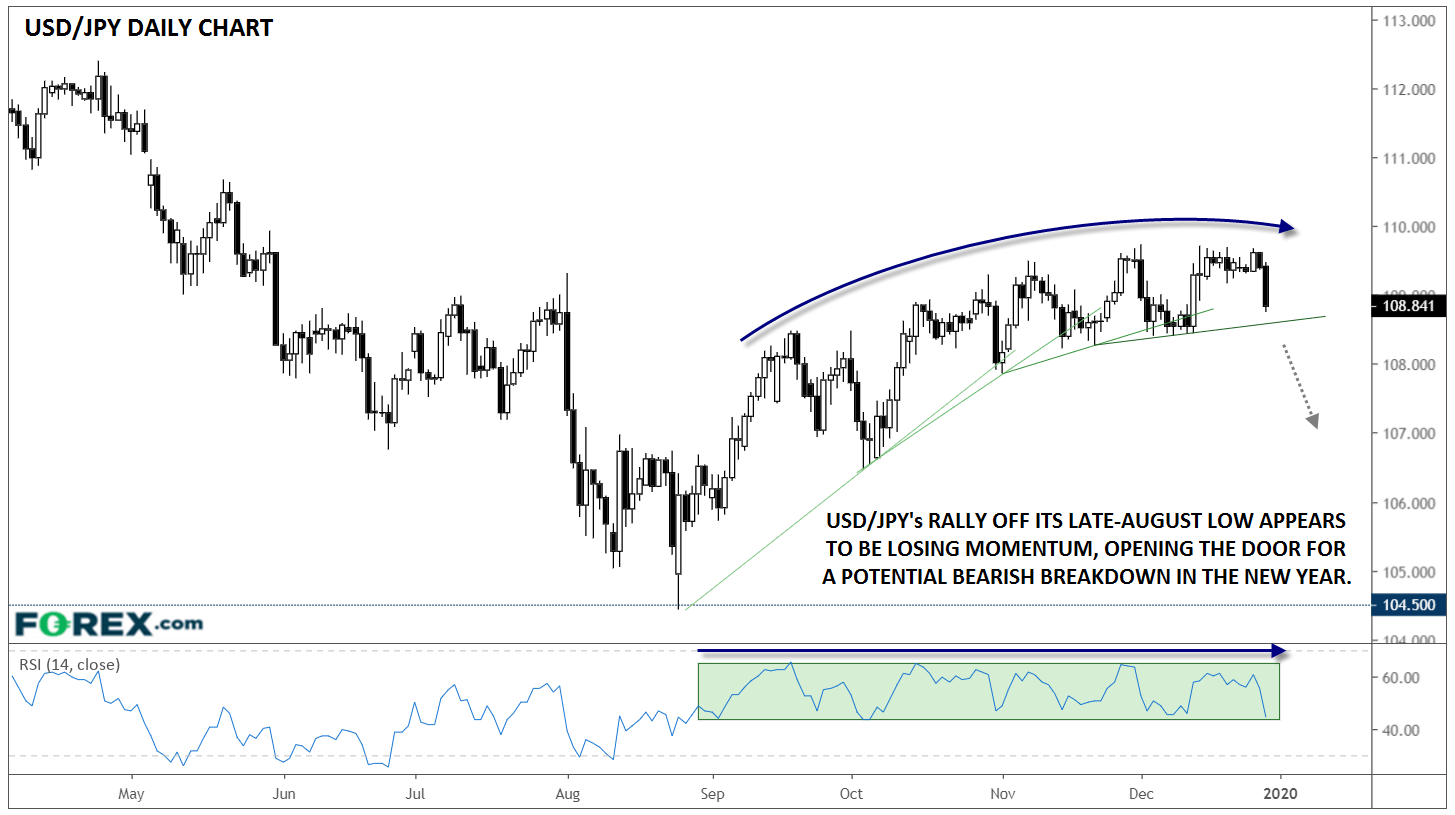
Regardless of whether you’re trying to squeeze out a few more pips this year or sitting on your hands until the new year, USD/JPY is worth keeping a close eye on. The pair has been oscillating within 100 pips of the 109.00 handle for nearly two full months now, providing a clear opportunity for short-term traders to buy off support and sell off resistance.
Taking a step back though, there are technical signs that the pair is vulnerable to breaking down. Since bottoming near 104.50 in late August, each successive “higher low” in USD/JPY has come at a lower trajectory than the one before, signaling fading buying momentum. Similarly, none of the “higher highs” over that period have been confirmed by a corresponding new high in the RSI indicator, a classic bearish divergence that could indicate a potential reversal in the coming days:
Source: TradingView, GAIN Capital
In terms of levels to watch, a break below the November/December support area from 108.25-108.40 could open the door for a deeper retracement toward 107.00 or the mid-106.00s. Astute traders will be watching for a breakdown in the daily RSI indicator below its corresponding range as a potential leading indicator for a breakdown in USD/JPY itself. Only a convincing bullish breakout above 109.75 accompanied by a breakout in the RSI indicator would shift the medium-term bias back in favor of the bulls.
Latest market news




The complete CFD trading experience
Award-winning platforms, competitive spreads, low commissions and dedicated support.
We live and breathe the markets and are dedicated to helping traders realise their ambitions as we continue to set the industry bar.
Economic calendar
Web Trader platform
Our sophisticated web-based platform is packed with features.
Related articles
USD/JPY outlook: Hawkish Fed recalibration pressures the yen
Stronger US growth momentum and rising Treasury yields are keeping USD/JPY pointed higher, even as Japanese policymakers try to limit the pressure building across domestic markets.
USD/MXN Forecast: Peso Loses Momentum Ahead of Banxico Decision
Over recent trading sessions, the Mexican peso has started to show signs of losing strength against the U.S. dollar. This can be seen in the performance of USD/MXN, which has gained more than 1.7% over the last three sessions, highlighting the dollar's renewed strength against the peso.

Euro Short-term Outlook: EUR/USD Selloff Nears Critical Yearly Support 9 23 2026
Euro has fallen seven of the past nine sessions, with stretched momentum raising the stakes as EUR/USD closes in on a major inflection zone.

StoneX Europe Ltd may make third party material available on this website which may contain information included but not limited to the conditions of financial markets. The material is for information purposes only and does not contain, and should not be construed as containing, investment advice and/or investment recommendation and/or an investment research and/or an offer of or solicitation for any transactions in financial instruments; any decision to enter into a specific transaction shall be made by the client following an assessment by him/her of their situation.
StoneX Europe Ltd makes no representation or warranty and assumes no liability as to the accuracy or completeness of the information provided, nor any loss arising from any investment based on a recommendation, forecast or other information supplied. You should always seek independent advice as to your suitability to speculate in any related markets and your ability to assume the associated risks, if you are at all unsure. We are not under any obligation to update any such material. Any opinion made may be personal to the author and may not reflect the opinion of StoneX Europe Ltd.