



USD/JPY hits its highest level since September 1998
USD/JPY continues to defy gravity and rose to a multiyear high, with US inflation ripping higher and the BOJ repeatedly broadcasting their ultra-loose monetary policy.
Share this:

The conditions for a higher USD/JPY have been perfect. US inflation continues to rise above expectations (and at an alarming rate), whilst the Fed’s 50 and forthcoming 75-bp hikes are doing little to dent it.
But we also have the BOJ fixated on an ultra-loose monetary policy, with both the central bank and government of Japan openly backing a weaker yen. And whilst there was some speculation the BOJ will be forced to intervene (to strengthen the currency) or adjust their yield curve control, no such action has risen whilst rhetoric from the central authorities of Japan favours a weaker currency.

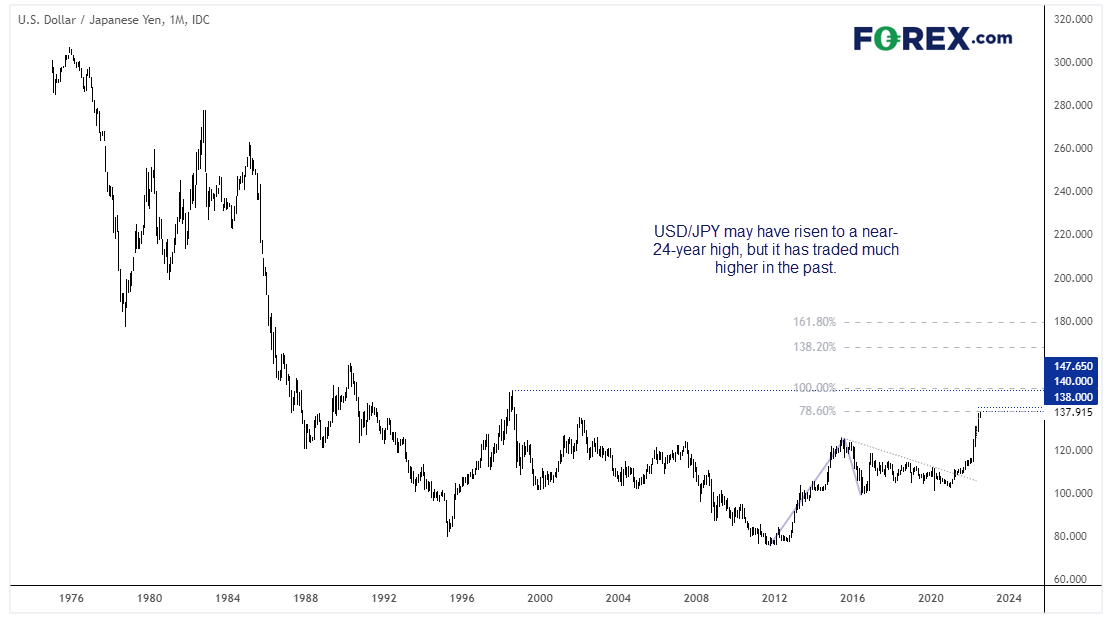
So today we saw USD/JPY rise to 138 for the first time since September 1998. Compared to recent history this is a very high level. But if we stand back and look at the longer-term picture then we can see it has traded much, much higher (twice as high, in fact). But to provide some historical context on how far this rally has come and what life was like the last time we traded here, we’ve picked out some historical facts from September 1998. Clearly this serves no market purpose, but it may provide some context for those newer to the game and some memories for those who are not.
What was going on when USD/JPY traded around 138 in September 1998?
- Former Bill President was having a hard time – as his testimony for his ‘alleged’ affair with Monika Lewinsky was released to the public.
- Aerosmith were number one in the US with the single “I Don’t Want to Miss a Thing”.
- Chris Tarrant hosted the first show of the UK gameshow “Who wants to be a Millionaire”?
- The 50th Emmy Awards were held, with “Frasier” being one of the winners.
USD/JPY 1-hour chart:


Back to the present day, we can see the rally has paused for breath around 138. It remains to be seen whether we’ll see a clear break higher in Asia, or simply pull back before a break in a later session or two. But I can see the US yields are rising (which tends to benefit USD/JPY bulls), and the 1-week put interest (downside protection) is its most active in a month.
For the fundamental reasons mentioned above, a move to 140 seems more than achievable and the technical shows a strong bullish trend. So even if prices do pull back from 138, I suspect it will remain of interest to bulls, with 138.50 making a likely interim target.
How to trade with City Index
You can easily trade with City Index by using these four easy steps:
- Open an account, or log in if you’re already a customer
• Open an account in the UK
• Open an account in Australia
• Open an account in Singapore
- Search for the company you want to trade in our award-winning platform
- Choose your position and size, and your stop and limit levels
- Place the trade
How to trade with FOREX.com
Follow these easy steps to start trading with FOREX.com today:
- Open a Forex.com account, or log in if you’re already a customer.
- Search for the pair you want to trade in our award-winning platform.
- Choose your position and size, and your stop and limit levels.
- Place the trade.
Related tags:
Latest market news




The complete CFD trading experience
Award-winning platforms, competitive spreads, low commissions and dedicated support.
We live and breathe the markets and are dedicated to helping traders realise their ambitions as we continue to set the industry bar.
Economic calendar
Web Trader platform
Our sophisticated web-based platform is packed with features.
Related articles
US Core PCE Preview: Stale or Significant for the Fed
Core PCE inflation takes center stage Wednesday, with traders watching for signs of renewed price pressure and clues on whether the Fed could hike again in October.
Australian Dollar Forecast: AUD/USD Four-Week Slide Nears Critical Uptrend Support 9 29 2026
Aussie momentum has deteriorated sharply into quarter-end, with inflation, Core PCE and NFP on tap as AUD/USD closes in on a pivotal technical threshold.

Euro Forecast: EUR/USD Tumbles Towards Yearly Low as Daily RSI Goes Oversold
EUR/USD has been hit hard in the final month of the quarter as USD strength has shown up in a big way. With the pair set to challenge its yearly low as RSI has pushed into oversold territory, is there a chance for a pullback with some big headline risk hitting in the US over the next few days?

StoneX Europe Ltd may make third party material available on this website which may contain information included but not limited to the conditions of financial markets. The material is for information purposes only and does not contain, and should not be construed as containing, investment advice and/or investment recommendation and/or an investment research and/or an offer of or solicitation for any transactions in financial instruments; any decision to enter into a specific transaction shall be made by the client following an assessment by him/her of their situation.
StoneX Europe Ltd makes no representation or warranty and assumes no liability as to the accuracy or completeness of the information provided, nor any loss arising from any investment based on a recommendation, forecast or other information supplied. You should always seek independent advice as to your suitability to speculate in any related markets and your ability to assume the associated risks, if you are at all unsure. We are not under any obligation to update any such material. Any opinion made may be personal to the author and may not reflect the opinion of StoneX Europe Ltd.