






Volatile Durable Goods Orders decline in July DXY
One of the reasons Durable Goods Orders is so volatile is because of new orders for aircraft.
Share this:

Orders for large ticket items, such as aircraft and autos, fell by -0.1% MoM in July vs expectations of -0.3% and a reading of +0.8% in June. One of the reasons Durable Goods Orders is so volatile is because of new orders for aircraft. Boeing had a reduction in orders, which helped bring the headline number lower. It was the first contraction in 3 months. Excluding transportation, Durable Goods orders actually increased by 0.7%. However, without the governments help in the defense sector, the print would have been even worse, at -1.2%! The government increased their orders in defense spending by over 20%, which helped support the headline number.
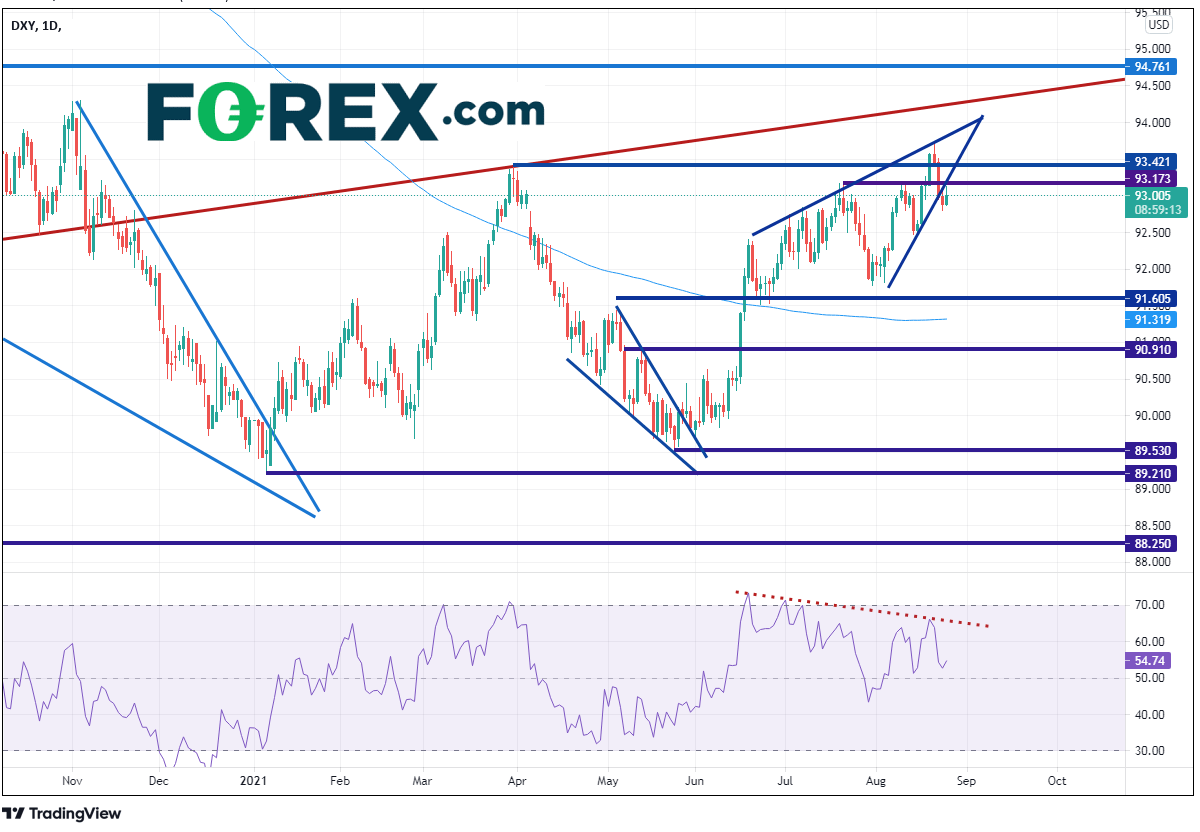
The US Dollar Index, which had set a new high for the year last week, had been forming an ascending triangle. However, after testing the top trendline of the ascending wedge on Friday, the DXY began moving lower and broke below the bottom trendline yesterday. Notice that the RSI had been diverging with price as DXY put in the new high. Today, the index is trying to stage a recovery, however it is up against both horizontal resistance and the upward sloping trendline of the wedge near 93.14.
Source: Tradingview, FOREX.com
What is the US Dollar Index (DXY)?
So, will the DXY continue moving lower? A large part of this answer will be determined by Fed Chairman Powell’s speech at Jackson Hole on Friday. (Check out Matt Weller’s preview) The DXY had paused on its pullback near the 61.8% Fibonacci retracement level from the August 13th lows to the August 20th highs, near 92.95. From a technical standpoint, it appears as if the DXY could move lower. If the US Dollar Index can’t move above the 93.14 level, it will have formed a flag pattern. The target for a flag pattern is the length of the flagpole added to the breakdown point, which would be near 92.25. However, it must first get through support at the bottom of the flag at 92.80 and the August 13th lows at 92.47.
Source: Tradingview, FOREX.com
Although Durable Goods Orders data show a valuable part of business spending for a particular month, they tend to be volatile and sometimes may not be a good economic indicator for determining market direction. With Powell speaking on Friday at Jackson Hole, traders seem to have their attention focused on whether or not he will make a tapering announcement at that time. Traders will be positioning themselves ahead of Friday!
Learn more about forex trading opportunities.
Orders for large ticket items, such as aircraft and autos, fell by -0.1% MoM in July vs expectations of -0.3% and a reading of +0.8% in June. One of the reasons Durable Goods Orders is so volatile is because of new orders for aircraft. Boeing had a reduction in orders, which helped bring the headline number lower. It was the first contraction in 3 months. Excluding transportation, Durable Goods orders actually increased by 0.7%. However, without the governments help in the defense sector, the print would have been even worse, at -1.2%! The government increased their orders in defense spending by over 20%, which helped support the headline number.
The US Dollar Index, which had set a new high for the year last week, had been forming an ascending triangle. However, after testing the top trendline of the ascending wedge on Friday, the DXY began moving lower and broke below the bottom trendline yesterday. Notice that the RSI had been diverging with price as DXY put in the new high. Today, the index is trying to stage a recovery, however it is up against both horizontal resistance and the upward sloping trendline of the wedge near 93.14.
Source: Tradingview, FOREX.com
What is the US Dollar Index (DXY)?
So, will the DXY continue moving lower? A large part of this answer will be determined by Fed Chairman Powell’s speech at Jackson Hole on Friday. (Check out Matt Weller’s preview) The DXY had paused on its pullback near the 61.8% Fibonacci retracement level from the August 13th lows to the August 20th highs, near 92.95. From a technical standpoint, it appears as if the DXY could move lower. If the US Dollar Index can’t move above the 93.14 level, it will have formed a flag pattern. The target for a flag pattern is the length of the flagpole added to the breakdown point, which would be near 92.25. However, it must first get through support at the bottom of the flag at 92.80 and the August 13th lows at 92.47.
Source: Tradingview, FOREX.com
Although Durable Goods Orders data show a valuable part of business spending for a particular month, they tend to be volatile and sometimes may not be a good economic indicator for determining market direction. With Powell speaking on Friday at Jackson Hole, traders seem to have their attention focused on whether or not he will make a tapering announcement at that time. Traders will be positioning themselves ahead of Friday!
Learn more about forex trading opportunities.
Related tags:

The complete CFD trading experience
Award-winning platforms, competitive spreads, low commissions and dedicated support.
We live and breathe the markets and are dedicated to helping traders realise their ambitions as we continue to set the industry bar.
Economic calendar
Web Trader platform
Our sophisticated web-based platform is packed with features.
Related articles

Gold forecast: XAU/USD could take a larger dive after the big rise in yields
Gold prices have been falling in the last few days after last week’s post-FOMC pop faded amid rising interest rate expectations, higher oil prices and a strengthening US dollar. As before, I wasn’t convinced gold would thrive in the current macro backdrop.


USD/JPY outlook: Hawkish Fed recalibration pressures the yen
Stronger US growth momentum and rising Treasury yields are keeping USD/JPY pointed higher, even as Japanese policymakers try to limit the pressure building across domestic markets.


Gold, silver slammed as hawkish Fed repricing reignites dollar upside
Gold and silver had held up surprisingly well against surging US yields. Wednesday’s DXY breakout may have changed that equation.
StoneX Europe Ltd may make third party material available on this website which may contain information included but not limited to the conditions of financial markets. The material is for information purposes only and does not contain, and should not be construed as containing, investment advice and/or investment recommendation and/or an investment research and/or an offer of or solicitation for any transactions in financial instruments; any decision to enter into a specific transaction shall be made by the client following an assessment by him/her of their situation.
StoneX Europe Ltd makes no representation or warranty and assumes no liability as to the accuracy or completeness of the information provided, nor any loss arising from any investment based on a recommendation, forecast or other information supplied. You should always seek independent advice as to your suitability to speculate in any related markets and your ability to assume the associated risks, if you are at all unsure. We are not under any obligation to update any such material. Any opinion made may be personal to the author and may not reflect the opinion of StoneX Europe Ltd.