








Weekly COT Report Trade Optimism Supports CAD and AUD
A summary of the weekly Commitment of Traders Report (COT) from CFTC to show market positioning among large speculators.
Share this:

Read our guide on how to interpret the weekly COT report
As of Tuesday 5th November:
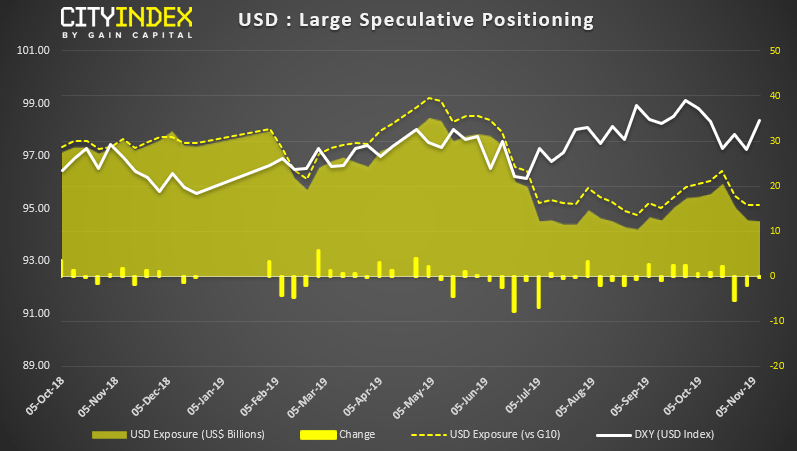
- Large speculators were net-long USD by $12.2 billion, down by $0.34 billion the prior week
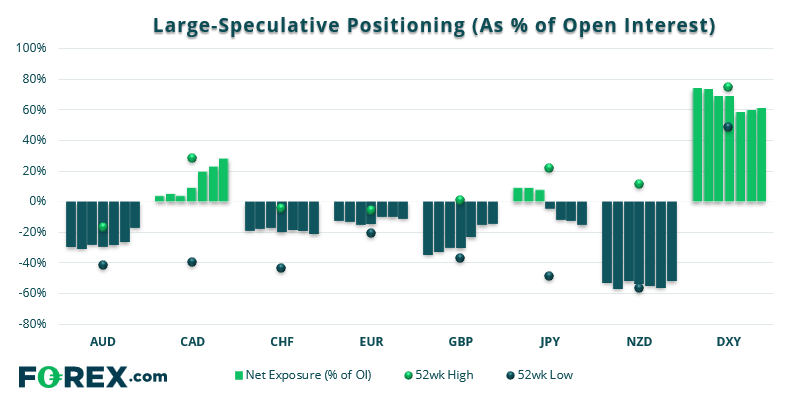
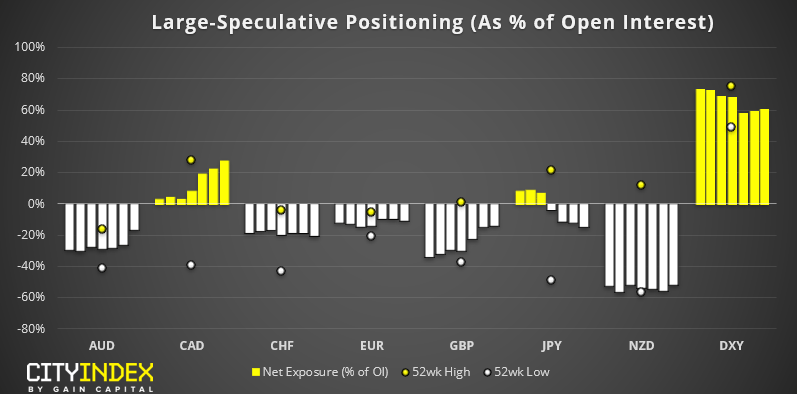
- CAD traders were their most bullish in two years
- AUD traders were their least bearish since January
- AUD also saw the largest weekly change, with net-short exposure being reduced by 13.5k contracts
USD: DXY has rebounded from key support (which is heavily weighted to Euro), yet the broader measure of USD positioning is not confirming the move. This could suggest the rebound is simply corrective, so perhaps USD will break to new lows. Yet over the near-term, bullish momentum prevails and there are no clear signs of a top forming, so the bias for USD remains bullish.
CAD: It seems that trade deal optimism has overcome the dovish BOC meeting, with net-long exposure at its highest level in 2 years. Moreover, the move is fuelled by an increase in bullish bets and reduction of shorts, which is the backbone of a healthy move. Still, seeing as demand for USD remains, it could cap volatility for USD/CAD and make directional moves harder to come by.
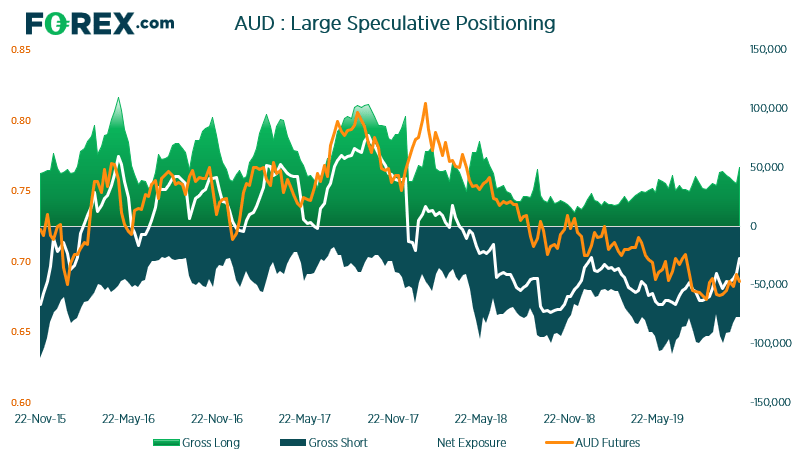
AUD: Bears continue to flee whilst long interest perks up. Gross-long exposure is its highest level since June 2018 and gross shorts are at their lowest level since September. Like CAD, the Aussie is reaping the rewards of better US-China trade relations, which leaves it open to further upside should the phase one trade deal get signed.
As of Tuesday 5th November:
- Positioning on gold and silver was little changed.
- Net-long exposure on WTI rose to a 6-week high.
- Traders were their least bullish on Copper since June.
- Positioning on platinum and palladium continue to diverge, with the former seeing its bullish exposure at its highest level since September 2016 and the latter seeing bullish exposure fall to a 6-week low.
Gold: Bullish exposure nudged it way to a 6-week high. Yet we’ve seen a notable drop in gold prices since the gold report was compiled, some longs may have been squeezed along the way. Spot prices are teasing a break of 1459 and, given the bearish momentum, a breakdown appears likely. Yet the core view remains that this is still part of a much-needed correction from its highs, so the bias is bearish over a near-term horizon only. After which, we’ll look for evidence that the corrective low is in.
Read our guide on how to interpret the weekly COT report
As of Tuesday 5th November:
- Large speculators were net-long USD by $12.2 billion, down by $0.34 billion the prior week
- CAD traders were their most bullish in two years
- AUD traders were their least bearish since January
- AUD also saw the largest weekly change, with net-short exposure being reduced by 13.5k contracts
USD: DXY has rebounded from key support (which is heavily weighted to Euro), yet the broader measure of USD positioning is not confirming the move. This could suggest the rebound is simply corrective, so perhaps USD will break to new lows. Yet over the near-term, bullish momentum prevails and there are no clear signs of a top forming, so the bias for USD remains bullish.
CAD: It seems that trade deal optimism has overcome the dovish BOC meeting, with net-long exposure at its highest level in 2 years. Moreover, the move is fuelled by an increase in bullish bets and reduction of shorts, which is the backbone of a healthy move. Still, seeing as demand for USD remains, it could cap volatility for USD/CAD and make directional moves harder to come by.
AUD: Bears continue to flee whilst long interest perks up. Gross-long exposure is its highest level since June 2018 and gross shorts are at their lowest level since September. Like CAD, the Aussie is reaping the rewards of better US-China trade relations, which leaves it open to further upside should the phase one trade deal get signed.
As of Tuesday 5th November:
- Positioning on gold and silver was little changed.
- Net-long exposure on WTI rose to a 6-week high.
- Traders were their least bullish on Copper since June.
- Positioning on platinum and palladium continue to diverge, with the former seeing its bullish exposure at its highest level since September 2016 and the latter seeing bullish exposure fall to a 6-week low.
Gold: Bullish exposure nudged it way to a 6-week high. Yet we’ve seen a notable drop in gold prices since the gold report was compiled, some longs may have been squeezed along the way. Spot prices are teasing a break of 1459 and, given the bearish momentum, a breakdown appears likely. Yet the core view remains that this is still part of a much-needed correction from its highs, so the bias is bearish over a near-term horizon only. After which, we’ll look for evidence that the corrective low is in.
Latest market news




The complete CFD trading experience
Award-winning platforms, competitive spreads, low commissions and dedicated support.
We live and breathe the markets and are dedicated to helping traders realise their ambitions as we continue to set the industry bar.
Economic calendar
Web Trader platform
Our sophisticated web-based platform is packed with features.
Related articles
S&P 500 Forecast: SPX rises as oil prices fall, but treasuries remain at multi-decade highs
U.S. stocks are rising on Friday after a volatile week that saw a surge in Treasury yields ripple through financial markets.
USD/JPY Q4 2026 Outlook: Hawkish Fed Pricing Clashes With Intervention Risk
The year-end tug-of-war is clear: hawkish Fed pricing supports USD/JPY, while intervention risk limits the upside.


Japanese Yen Forecast: USD/JPY 4% Rally Challenges Post-Intervention Downtrend 9 24 2026
USD/JPY momentum has shifted sharply higher, putting a major resistance confluence in focus as U.S. and Japanese event risk builds.

StoneX Europe Ltd may make third party material available on this website which may contain information included but not limited to the conditions of financial markets. The material is for information purposes only and does not contain, and should not be construed as containing, investment advice and/or investment recommendation and/or an investment research and/or an offer of or solicitation for any transactions in financial instruments; any decision to enter into a specific transaction shall be made by the client following an assessment by him/her of their situation.
StoneX Europe Ltd makes no representation or warranty and assumes no liability as to the accuracy or completeness of the information provided, nor any loss arising from any investment based on a recommendation, forecast or other information supplied. You should always seek independent advice as to your suitability to speculate in any related markets and your ability to assume the associated risks, if you are at all unsure. We are not under any obligation to update any such material. Any opinion made may be personal to the author and may not reflect the opinion of StoneX Europe Ltd.