









Weekly COT Report USD Bullish Interest Drops To a 14 Month low
A summary of the weekly Commitment of Traders Report (COT) from CFTC to show market positioning among large speculators.
Share this:

As of Tuesday 27th August:
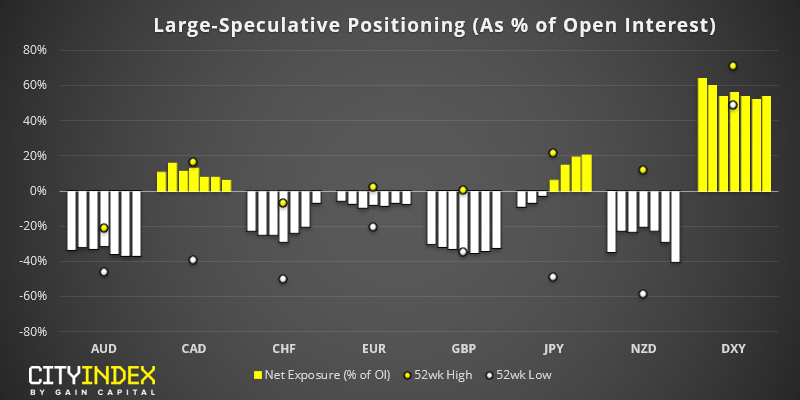
- Traders were net-long USD by $10.6 billion, down -$0.34 billion from the prior week to make a fresh 14-month low. Against G10 currencies, traders are net long by $13.68 billion, down -$0.82 from the prior week.
- Traders increased net-short exposure on NZD by 7,787 contracts and reduced short exposure on CHF by 7,317 contracts.
- Traders are their least bearish on CHF since October 2017
- Overall, there were minor adjustments for the week and all changes were below 10k contracts.
USD: The US dollar index (USD) remains resilient, despite the dwindling bullish interest among large speculators. As of Friday, it saw its most bullish weekly close since May 2017 and the trade weighted index is at an all-time high. We previously noted that the USD tends to strengthen when the Fed ease, and it’s making no exception this time around. So, we’re curious as to why large speculators seem wary of the dollar and to when they’ll once again correlate with price action (and whether that means the dollar rolls over, or large speculators turn up to the part late).
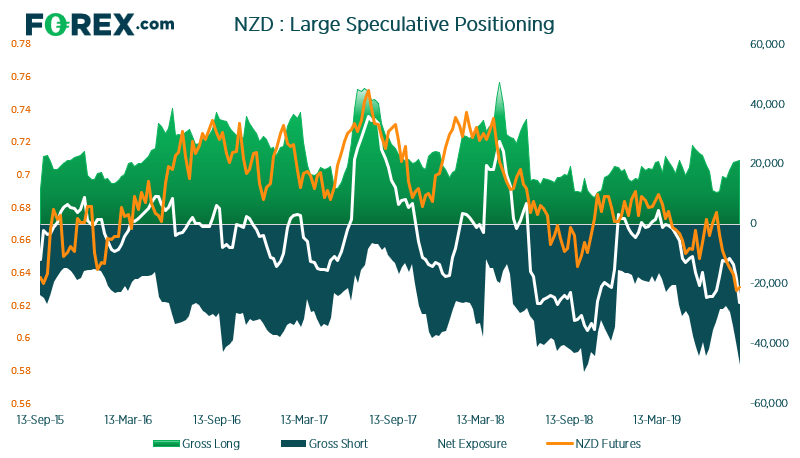
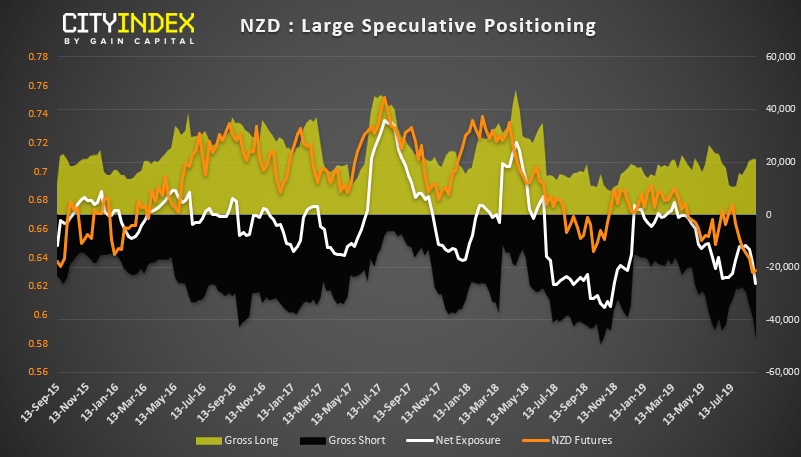
NZD: The bears are clearly in control, with prices closing to their lowest level since August 2015. Net-short exposure is its most bearish since November, although gross-short exposure is at historically bearish levels which raises the prospect for an inflection point to occur. Interestingly, RBNZ have cut by 50 bps points and not giving the impression another cut is pending, and data is outperforming expectations according to the CESI (Citi Economic Surprise Index). Moreover, OIS rates place a low probability of a cut this year. From that we assume it is the trade war which is weighing the Kiwi down, so any positive developments on that front could see some rapid short-covering. Until then, the trend points lower, even if it does look stretched from most metrics.
CHF: Despite its safe-haven appeal, traders have been net-short the Swiss franc for two years. However, at the current rate of trajectory, this could be about to change. Net-short exposure was reduced by 22% last week, from 11.2k to 3.8k short exposure. Moreover, we noted that CHF generally performs well in September according to seasonality of the past 30-years, so we’re keep to see if it follows its historic path this year too.
As of Tuesday 27th August:
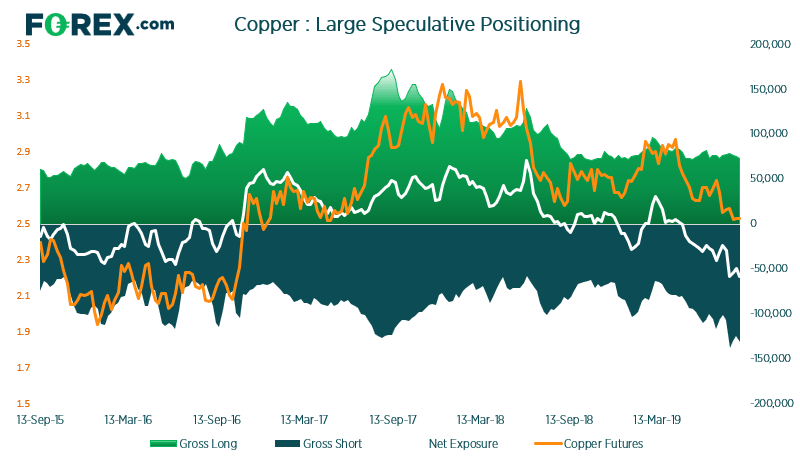
- Bearish exposure on copper hits a record high
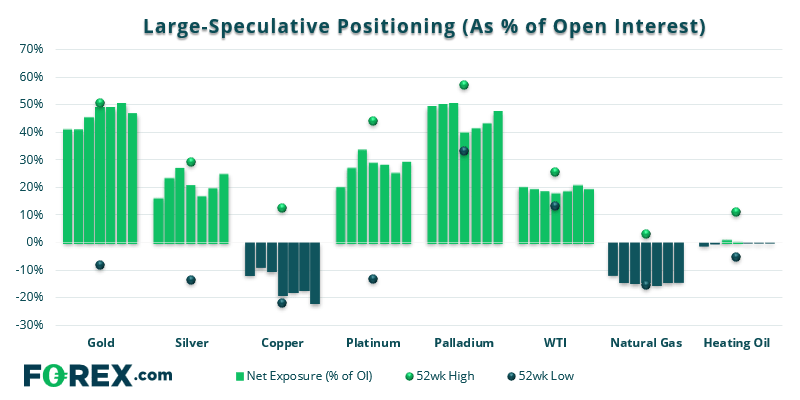
- Net-long exposure on gold dipped by 3,155 contracts, with bears initiating 13,470 short contracts
- Net-long exposure on Silver moves to a 6-week high
Gold: Without trying to sound like a broken record, bullish exposure on gold continues to look stretched on every metric. Net and gross-long exposure are at levels that have been associated with inflection points, although the current dynamic of trade wars and a bearish Fed continue to support prices, so if we don’t see a large correction, we could see gold trade sideways until its next lev higher. Whilst we’re not saying it can’t go higher form here, once should question the reward to risk potential, given its parabolic move in recent weeks.
Copper: traders have been net-short on copper for 18 consecutive weeks, and at their most bearish level on record. We highlighted the multi-month head and shoulders top recently, so we’re now waiting for prices to confirm large speculators grizzly view. Or, for them to short-cover and prices soaring. Given the lack ‘credible’ developments on the trade-war front, we’re waiting for prices to roll over.
Related analysis:
The Week Head: Central Bank Meetings and NFP
Historically, September Has Been A Bearish Month For USD/CHF
Fib Extensions Point to a Possible Bounce in NZD/USD
As of Tuesday 27th August:
- Traders were net-long USD by $10.6 billion, down -$0.34 billion from the prior week to make a fresh 14-month low. Against G10 currencies, traders are net long by $13.68 billion, down -$0.82 from the prior week.
- Traders increased net-short exposure on NZD by 7,787 contracts and reduced short exposure on CHF by 7,317 contracts.
- Traders are their least bearish on CHF since October 2017
- Overall, there were minor adjustments for the week and all changes were below 10k contracts.
USD: The US dollar index (USD) remains resilient, despite the dwindling bullish interest among large speculators. As of Friday, it saw its most bullish weekly close since May 2017 and the trade weighted index is at an all-time high. We previously noted that the USD tends to strengthen when the Fed ease, and it’s making no exception this time around. So, we’re curious as to why large speculators seem wary of the dollar and to when they’ll once again correlate with price action (and whether that means the dollar rolls over, or large speculators turn up to the part late).
NZD: The bears are clearly in control, with prices closing to their lowest level since August 2015. Net-short exposure is its most bearish since November, although gross-short exposure is at historically bearish levels which raises the prospect for an inflection point to occur. Interestingly, RBNZ have cut by 50 bps points and not giving the impression another cut is pending, and data is outperforming expectations according to the CESI (Citi Economic Surprise Index). Moreover, OIS rates place a low probability of a cut this year. From that we assume it is the trade war which is weighing the Kiwi down, so any positive developments on that front could see some rapid short-covering. Until then, the trend points lower, even if it does look stretched from most metrics.
CHF: Despite its safe-haven appeal, traders have been net-short the Swiss franc for two years. However, at the current rate of trajectory, this could be about to change. Net-short exposure was reduced by 22% last week, from 11.2k to 3.8k short exposure. Moreover, we noted that CHF generally performs well in September according to seasonality of the past 30-years, so we’re keep to see if it follows its historic path this year too.
As of Tuesday 27th August:
- Bearish exposure on copper hits a record high
- Net-long exposure on gold dipped by 3,155 contracts, with bears initiating 13,470 short contracts
- Net-long exposure on Silver moves to a 6-week high
Gold: Without trying to sound like a broken record, bullish exposure on gold continues to look stretched on every metric. Net and gross-long exposure are at levels that have been associated with inflection points, although the current dynamic of trade wars and a bearish Fed continue to support prices, so if we don’t see a large correction, we could see gold trade sideways until its next lev higher. Whilst we’re not saying it can’t go higher form here, once should question the reward to risk potential, given its parabolic move in recent weeks.
Copper: traders have been net-short on copper for 18 consecutive weeks, and at their most bearish level on record. We highlighted the multi-month head and shoulders top recently, so we’re now waiting for prices to confirm large speculators grizzly view. Or, for them to short-cover and prices soaring. Given the lack ‘credible’ developments on the trade-war front, we’re waiting for prices to roll over.
Related analysis:
The Week Head: Central Bank Meetings and NFP
Historically, September Has Been A Bearish Month For USD/CHF
Fib Extensions Point to a Possible Bounce in NZD/USD


The complete CFD trading experience
Award-winning platforms, competitive spreads, low commissions and dedicated support.
We live and breathe the markets and are dedicated to helping traders realise their ambitions as we continue to set the industry bar.
Economic calendar
Web Trader platform
Our sophisticated web-based platform is packed with features.
Related articles
Gold, silver slammed as hawkish Fed repricing reignites dollar upside
Gold and silver had held up surprisingly well against surging US yields. Wednesday’s DXY breakout may have changed that equation.

USD/MXN Forecast: Peso Loses Momentum Ahead of Banxico Decision
Over recent trading sessions, the Mexican peso has started to show signs of losing strength against the U.S. dollar. This can be seen in the performance of USD/MXN, which has gained more than 1.7% over the last three sessions, highlighting the dollar's renewed strength against the peso.


Euro Short-term Outlook: EUR/USD Selloff Nears Critical Yearly Support 9 23 2026
Euro has fallen seven of the past nine sessions, with stretched momentum raising the stakes as EUR/USD closes in on a major inflection zone.

StoneX Europe Ltd may make third party material available on this website which may contain information included but not limited to the conditions of financial markets. The material is for information purposes only and does not contain, and should not be construed as containing, investment advice and/or investment recommendation and/or an investment research and/or an offer of or solicitation for any transactions in financial instruments; any decision to enter into a specific transaction shall be made by the client following an assessment by him/her of their situation.
StoneX Europe Ltd makes no representation or warranty and assumes no liability as to the accuracy or completeness of the information provided, nor any loss arising from any investment based on a recommendation, forecast or other information supplied. You should always seek independent advice as to your suitability to speculate in any related markets and your ability to assume the associated risks, if you are at all unsure. We are not under any obligation to update any such material. Any opinion made may be personal to the author and may not reflect the opinion of StoneX Europe Ltd.