






What do current PMIs say about the global economy
With strong PMI data, the recovery process seems to be well underway
Share this:

The IHS Markit Purchasing Managers’ Index (PMI) monthly data are compiled by surveys of senior executives at private sector companies in over 40 different countries (via marketeconomics.com). The main headline surveys include a Manufacturing PMI, a Services PMI, and a Composite PMI (although some countries only release Manufacturing PMI). The preliminary PMI reading for the current month is released near the 20th of the month and the final readings are released at the beginning of the following month. A reading above 50 is considered to be expansionary for the economy while a country is considered to be contracting when the reading is under 50.
Is the pandemic nearing an end?
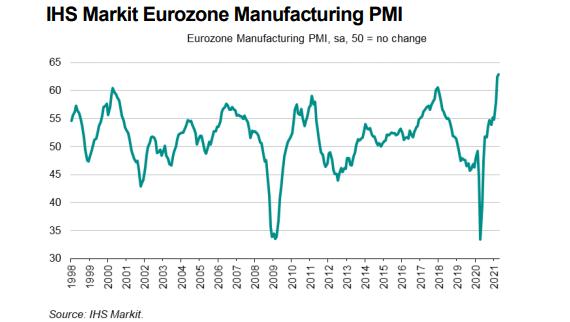
On Monday, IHS Markit released the final readings for April’s Manufacturing PMI data. While re-openings after the coronavirus are occurring at different rates, current demand and expected demand are driving these PMI indexes higher. All the G-20 readings are in expansion territory, with the exception of Mexico. Some areas have readings at all-time highs, such as Australia, the Eurozone (although readings vary among countries), the UK, and the US And some have readings well above 60!
Source: IHS Markit
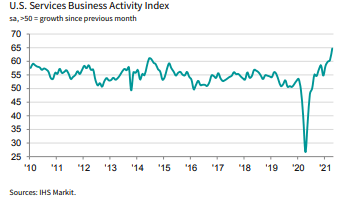
Earlier today, IHS Markit released the final readings for April’s Services PMI and Composite PMI data. The service sector has been hit much harder by the coronavirus than the manufacturing sector. As a result, with the re-openings occurring at different paces, the service sector data was mixed, globally. In counties where the vaccinations are occurring more rapidly and economies are re-opening more quickly, the Services PMIs are at record highs. These include countries such as the US, Australia, and the UK. However, other countries are still under lockdowns and restrictions. As a result, their readings are in contraction territory. These include countries such as Germany, Italy, Switzerland and Japan. (The Eurozone area reading as a whole was 50.5).
Source: IHS Markit
As for the Composite PMIs, the results were once again mixed. However, all of the G20 readings which report were in expansionary territory, with the exception of Brazil. The US and UK had readings at or near all-time highs, Eurozone counties were in the low to mid-50s range.
Inflation?
Note also that input costs and output charges, which are two components of the indexes, are also at or near all-time highs. This is due to higher supplier and transportation fees, as well as higher average prices charged. The result should be an increase in inflation expectations, which would normally cause central banks to become less dovish. However, most G20 central banks, with the exception on Canada, consider this inflation to be transitory and cannot be sustained at these levels. Therefore, these central banks are “on hold” as they wait for more data before considering tapering.
DXY
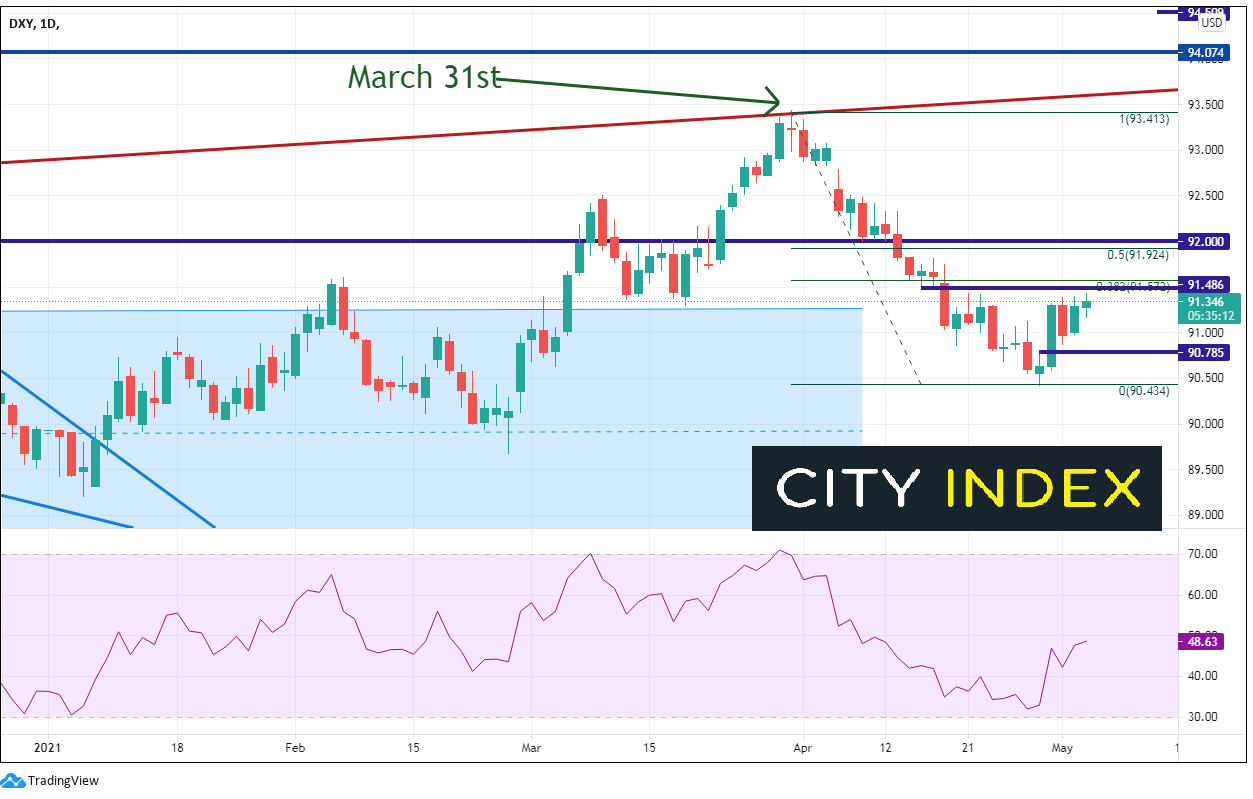
The first and second quarters of the year have been dramatically different thus far in terms of direction for the US Dollar Index. The DYX moved from a low of 89.21 on January 6th to a high of 93.43 at the end of the first quarter in March 31st. Inflation expectations and bond yields moved higher as well. At the beginning of Q2, the DXY reversed and moved lower, to as low as 90.42 on April 29th. Yields pulled back mildly, but not nearly as much as the DXY. May has started well for the US Dollar Index with the stellar PMI data. Horizontal resistance is just above at 91.49. The next level of resistance is just above at the 38.2% Fibonacci retracement from the March 31st highs to the April 29th lows, near 91.57. Horizontal support below is at 90.78 and the April 29th lows if 90.43.
Source: Tradingview, City Index
With the strong PMI data throughout much of the world, the recovery process from the coronavirus seems to be well underway, albeit at different rates. The ultimate question that traders are asking now is “When will central banks notice and being to tighten monetary policy?”
Learn more about forex trading opportunities.
The IHS Markit Purchasing Managers’ Index (PMI) monthly data are compiled by surveys of senior executives at private sector companies in over 40 different countries (via marketeconomics.com). The main headline surveys include a Manufacturing PMI, a Services PMI, and a Composite PMI (although some countries only release Manufacturing PMI). The preliminary PMI reading for the current month is released near the 20th of the month and the final readings are released at the beginning of the following month. A reading above 50 is considered to be expansionary for the economy while a country is considered to be contracting when the reading is under 50.
Is the pandemic nearing an end?
On Monday, IHS Markit released the final readings for April’s Manufacturing PMI data. While re-openings after the coronavirus are occurring at different rates, current demand and expected demand are driving these PMI indexes higher. All the G-20 readings are in expansion territory, with the exception of Mexico. Some areas have readings at all-time highs, such as Australia, the Eurozone (although readings vary among countries), the UK, and the US And some have readings well above 60!
Source: IHS Markit
Earlier today, IHS Markit released the final readings for April’s Services PMI and Composite PMI data. The service sector has been hit much harder by the coronavirus than the manufacturing sector. As a result, with the re-openings occurring at different paces, the service sector data was mixed, globally. In counties where the vaccinations are occurring more rapidly and economies are re-opening more quickly, the Services PMIs are at record highs. These include countries such as the US, Australia, and the UK. However, other countries are still under lockdowns and restrictions. As a result, their readings are in contraction territory. These include countries such as Germany, Italy, Switzerland and Japan. (The Eurozone area reading as a whole was 50.5).
Source: IHS Markit
As for the Composite PMIs, the results were once again mixed. However, all of the G20 readings which report were in expansionary territory, with the exception of Brazil. The US and UK had readings at or near all-time highs, Eurozone counties were in the low to mid-50s range.
Inflation?
Note also that input costs and output charges, which are two components of the indexes, are also at or near all-time highs. This is due to higher supplier and transportation fees, as well as higher average prices charged. The result should be an increase in inflation expectations, which would normally cause central banks to become less dovish. However, most G20 central banks, with the exception on Canada, consider this inflation to be transitory and cannot be sustained at these levels. Therefore, these central banks are “on hold” as they wait for more data before considering tapering.
DXY
The first and second quarters of the year have been dramatically different thus far in terms of direction for the US Dollar Index. The DYX moved from a low of 89.21 on January 6th to a high of 93.43 at the end of the first quarter in March 31st. Inflation expectations and bond yields moved higher as well. At the beginning of Q2, the DXY reversed and moved lower, to as low as 90.42 on April 29th. Yields pulled back mildly, but not nearly as much as the DXY. May has started well for the US Dollar Index with the stellar PMI data. Horizontal resistance is just above at 91.49. The next level of resistance is just above at the 38.2% Fibonacci retracement from the March 31st highs to the April 29th lows, near 91.57. Horizontal support below is at 90.78 and the April 29th lows if 90.43.
Source: Tradingview, FOREX.com
With the strong PMI data throughout much of the world, the recovery process from the coronavirus seems to be well underway, albeit at different rates. The ultimate question that traders are asking now is “When will central banks notice and being to tighten monetary policy?”
Learn more about forex trading opportunities.
Related tags:



The complete CFD trading experience
Award-winning platforms, competitive spreads, low commissions and dedicated support.
We live and breathe the markets and are dedicated to helping traders realise their ambitions as we continue to set the industry bar.
Economic calendar
Web Trader platform
Our sophisticated web-based platform is packed with features.
Related articles

AUD/USD forecast: Currency Pair of the Week | September 28, 2026
The week has started with stocks, gold, silver and bitcoin all falling, as crude oil rebounded and bond yields pushed further higher. Trump refusing to agree to Tehran’s proposal to re-open the Strait of Hormuz has left the markets disappointed. Still, reports that mediators are expected to hold talks with the two sides on an amended version of the 7-day proposal that Iran presented, keeps hopes alive that we may see some progress.


Gold Outlook: XAU/USD hit hard as US yields, dollar resume ascent
A stronger dollar, surging front-end yields and renewed geopolitical tension have combined to push gold back towards key technical support.


EUR/USD weekly outlook: Oil, inflation and NFP in focus
After coming under significant pressure in recent weeks, the EUR/USD came off its lows to finish the week on a positive note on Friday, albeit with only a mild rebound. That was not enough to prevent the exchange rate falling for the third consecutive week, as the US dollar and bond yields rallied across the board.
StoneX Europe Ltd may make third party material available on this website which may contain information included but not limited to the conditions of financial markets. The material is for information purposes only and does not contain, and should not be construed as containing, investment advice and/or investment recommendation and/or an investment research and/or an offer of or solicitation for any transactions in financial instruments; any decision to enter into a specific transaction shall be made by the client following an assessment by him/her of their situation.
StoneX Europe Ltd makes no representation or warranty and assumes no liability as to the accuracy or completeness of the information provided, nor any loss arising from any investment based on a recommendation, forecast or other information supplied. You should always seek independent advice as to your suitability to speculate in any related markets and your ability to assume the associated risks, if you are at all unsure. We are not under any obligation to update any such material. Any opinion made may be personal to the author and may not reflect the opinion of StoneX Europe Ltd.