



What to expect from Chinese Tech Giants Alibaba and Tencent
Alibaba and Tencent will report quarterly results in November, while Reuters reported today that Alibaba's Ant Group could be blacklisted by the Trump administration...
Share this:
Alibaba Group (9988.hk): Consolidate Before Next Rally
Alibaba Group (9988.hk) is expected to report 2Q results in November (exact date not confirmed yet), with an adjusted EPS median forecast of 1.78 yuan, according to Bloomberg.
Even though Alibaba's share price has been surging since late September, investors would have to be cautious that Reuters reported today that U.S. State Department proposed to the Trump administration to put Alibaba's Ant Group to a trade blacklist.
From a technical point of view, Alibaba Group remains trading within a bullish channel drawn from May as shown on the daily chart. However, it might have formed a bearish shooting star candlestick on Wednesday, while there are signs of a bearish RSI divergence, suggesting there might be a pull-back in the shorter-term. The level at $271 might be considered as the nearest support, and if this level holds, prices are still likely to test the 1st and 2nd resistance at $305 and $320 respectively.

Source: Gain Capital, TradingView
Tencent (700.hk): Early Signs of an Upside Breakout
Tencent (700.hk) will report 3Q results on November 12 and Bloomberg's survey showed an adjusted EPS median forecast of 3.37 yuan, 32% higher than the prior-year quarter.
On a daily chart, Tencent appears to have gathered more upside momentum as it just broken above a 3-month bullish consolidation range, following a rally in the second quarter. The level at $528 might be considered as the nearest support, while the 1st and 2nd resistance are expected to be located at $584 and $630 respectively.

Source: Gain Capital, TradingView
Alibaba Group (9988.hk): Consolidate Before Next Rally
Alibaba Group (9988.hk) is expected to report 2Q results in November (exact date not confirmed yet), with an adjusted EPS median forecast of 1.78 yuan, according to Bloomberg.
Even though Alibaba's share price has been surging since late September, investors would have to be cautious that Reuters reported today that U.S. State Department proposed to the Trump administration to put Alibaba's Ant Group to a trade blacklist.
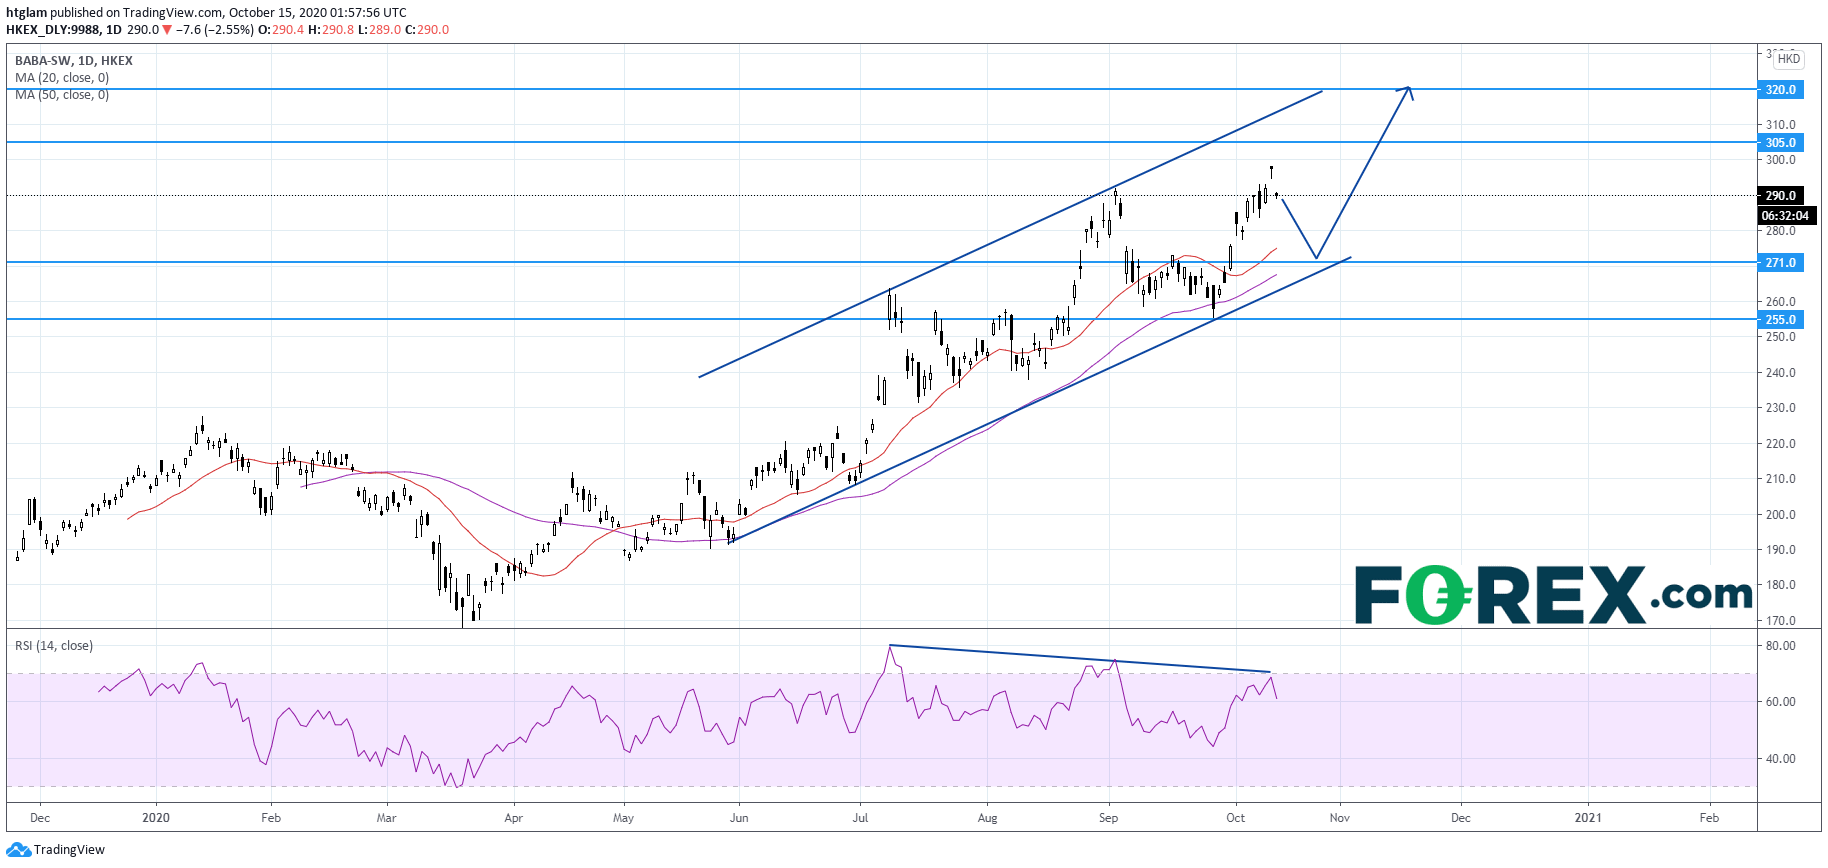
From a technical point of view, Alibaba Group remains trading within a bullish channel drawn from May as shown on the daily chart. However, it might have formed a bearish shooting star candlestick on Wednesday, while there are signs of a bearish RSI divergence, suggesting there might be a pull-back in the shorter-term. The level at $271 might be considered as the nearest support, and if this level holds, prices are still likely to test the 1st and 2nd resistance at $305 and $320 respectively.
Source: Gain Capital, TradingView
Tencent (700.hk): Early Signs of an Upside Breakout
Tencent (700.hk) will report 3Q results on November 12 and Bloomberg's survey showed an adjusted EPS median forecast of 3.37 yuan, 32% higher than the prior-year quarter.
On a daily chart, Tencent appears to have gathered more upside momentum as it just broken above a 3-month bullish consolidation range, following a rally in the second quarter. The level at $528 might be considered as the nearest support, while the 1st and 2nd resistance are expected to be located at $584 and $630 respectively.

Source: Gain Capital, TradingView
Related tags:
Latest market news




The complete CFD trading experience
Award-winning platforms, competitive spreads, low commissions and dedicated support.
We live and breathe the markets and are dedicated to helping traders realise their ambitions as we continue to set the industry bar.
Economic calendar
Web Trader platform
Our sophisticated web-based platform is packed with features.
Related articles

Nikkei threatens breakout as tech rebound broadens
Breakouts across the SOX and Nasdaq are being matched by rebounds across Asia, with the Nikkei now threatening to join the move.


S&P 500, Nasdaq 100 Forecast for the Week Ahead
A hawkish Fed and 10-Year Notes on the verge of a push above 5%, yet stocks have so far shrugged off that fear. But can it continue?


Hang Seng Tech rout nears make-or-break zone
The technical damage is clear, but with Hang Seng Tech now deeply stretched and approaching major support, the risk-reward is becoming more two-sided.
StoneX Europe Ltd may make third party material available on this website which may contain information included but not limited to the conditions of financial markets. The material is for information purposes only and does not contain, and should not be construed as containing, investment advice and/or investment recommendation and/or an investment research and/or an offer of or solicitation for any transactions in financial instruments; any decision to enter into a specific transaction shall be made by the client following an assessment by him/her of their situation.
StoneX Europe Ltd makes no representation or warranty and assumes no liability as to the accuracy or completeness of the information provided, nor any loss arising from any investment based on a recommendation, forecast or other information supplied. You should always seek independent advice as to your suitability to speculate in any related markets and your ability to assume the associated risks, if you are at all unsure. We are not under any obligation to update any such material. Any opinion made may be personal to the author and may not reflect the opinion of StoneX Europe Ltd.