





When the Bazooka Misses
Something’s not right.
Share this:

The New York Federal Reserve today said it would conduct $500 Billion 3 -month repo operations A DAY for the next 3 days. That is a possible $1.5 Trillion worth of treasury buying. This is not the typical “Not QE” we have been seeing since the Fall. This is the real thing, real QE. But one must consider that with such a HUGE move by the Fed, why did stocks pull back after a 150-handle rally in the S&P 500? Stocks rallied on the news from roughly 2500 to 2650, then traded back down to 2525? Something’s not right.
Source: Tradingview, CME, FOREX.com
What information can we get from this type of price action? This tells me that there are still a ton of people who are long the market from much higher, and still have not capitulated yet! They are willing to sell any bounce to get out, even if it means a “smaller” loss. One would think that there is still room left for the markets to go on the downside. In extreme selloffs like this, the move doesn’t seem to end until every long is squeezed out of the market!
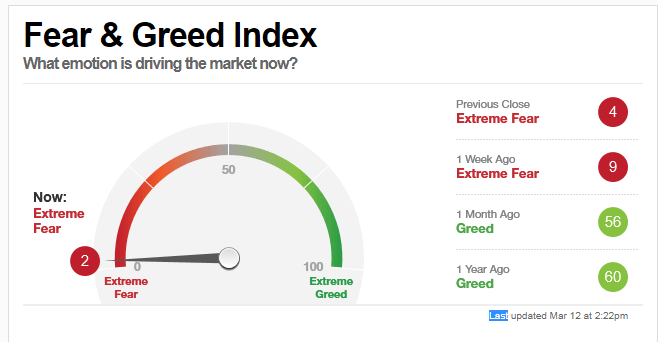
According to CNN’s Fear & Greed Index, the market is now in “Extreme Fear” at 2! The last reading before this article was at 2:22pm ET. The Fed announcement was at 1:00pm, and yet the index is still at 2. This is meant to be a contrarian indicator, just as any overbought or oversold oscillator. However, just as with any oscillator they can stay at extremes, until they don’t.
Source: Tradingview, CNN, City Index
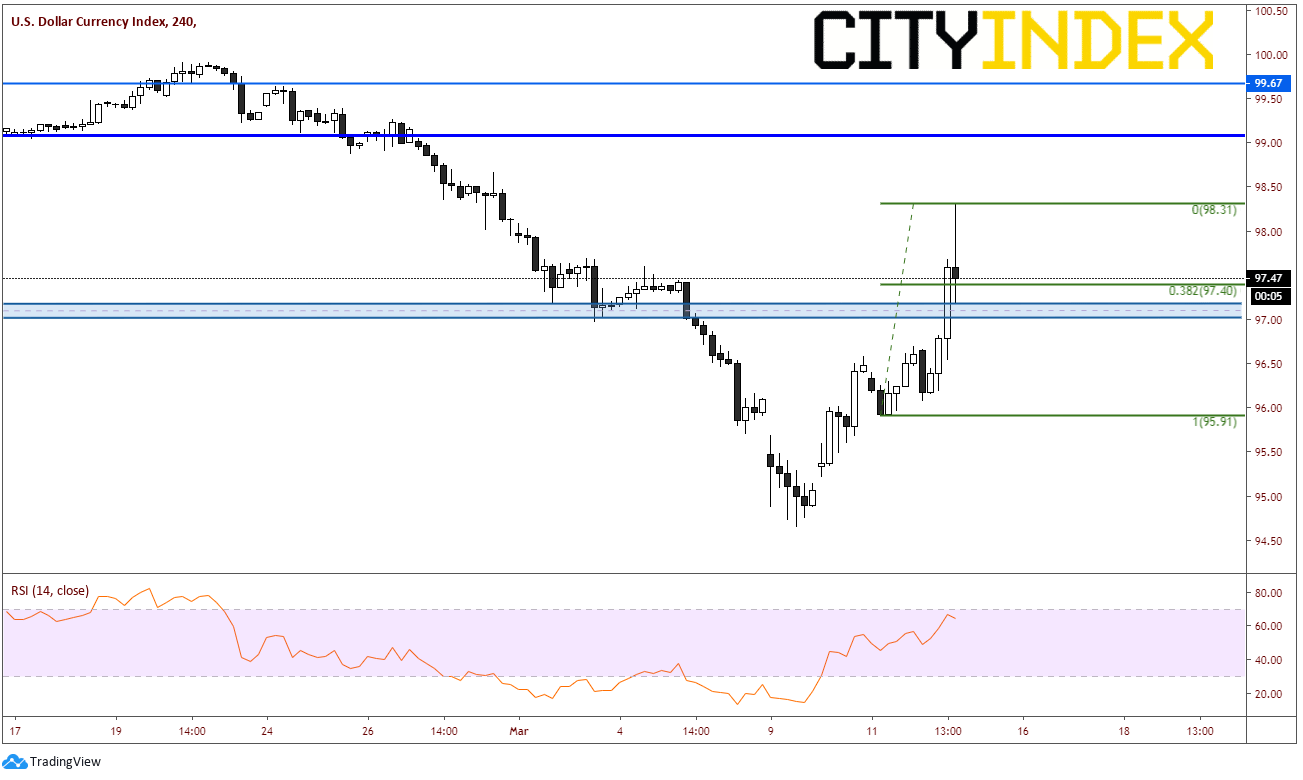
Take a look at the DXY. Price had been moving higher all day. It seems that the US Dollar is now the “safe haven” currency. However, on a 240-minute chart, the DXY is putting in a large shooting star formation. As the announcement was released by the Fed, the DXY moved lower, as there would be a fresh supply us US Dollars in the market. However, given the range of the day, 223 pips, one may have expected price to fall more than to the 38.2% Fibonacci retracement for the day. Mixed signals. There is support just below at 97.19 (the low of the candle), but with such a huge supply of US Dollars by the Fed, one could have expected a much larger retracement!
Source: Tradingview, City Index
What now?
Carry on. There is a large band of support in S&P 500 from the December 2018 lows between 2316.75 and 2475. That may seem like a rather large band for the S&P 500, however not these days. In DXY, with a shallow retracement, watch if price continues the move higher. If so, that will be confirmation that the bazooka missed its target!
The New York Federal Reserve today said it would conduct $500 Billion 3 -month repo operations A DAY for the next 3 days. That is a possible $1.5 Trillion worth of treasury buying. This is not the typical “Not QE” we have been seeing since the Fall. This is the real thing, real QE. But one must consider that with such a HUGE move by the Fed, why did stocks pull back after a 150-handle rally in the S&P 500? Stocks rallied on the news from roughly 2500 to 2650, then traded back down to 2525? Something’s not right.
Source: Tradingview, CME, FOREX.com
What information can we get from this type of price action? This tells me that there are still a ton of people who are long the market from much higher, and still have not capitulated yet! They are willing to sell any bounce to get out, even if it means a “smaller” loss. One would think that there is still room left for the markets to go on the downside. In extreme selloffs like this, the move doesn’t seem to end until every long is squeezed out of the market!
According to CNN’s Fear & Greed Index, the market is now in “Extreme Fear” at 2! The last reading before this article was at 2:22pm ET. The Fed announcement was at 1:00pm, and yet the index is still at 2. This is meant to be a contrarian indicator, just as any overbought or oversold oscillator. However, just as with any oscillator they can stay at extremes, until they don’t.
Source: Tradingview, CNN, FOREX.com
Take a look at the DXY. Price had been moving higher all day. It seems that the US Dollar is now the “safe haven” currency. However, on a 240-minute chart, the DXY is putting in a large shooting star formation. As the announcement was released by the Fed, the DXY moved lower, as there would be a fresh supply us US Dollars in the market. However, given the range of the day, 223 pips, one may have expected price to fall more than to the 38.2% Fibonacci retracement for the day. Mixed signals. There is support just below at 97.19 (the low of the candle), but with such a huge supply of US Dollars by the Fed, one could have expected a much larger retracement!
Source: Tradingview, FOREX.com
What now?
Carry on. There is a large band of support in S&P 500 from the December 2018 lows between 2316.75 and 2475. That may seem like a rather large band for the S&P 500, however not these days. In DXY, with a shallow retracement, watch if price continues the move higher. If so, that will be confirmation that the bazooka missed its target!


The complete CFD trading experience
Award-winning platforms, competitive spreads, low commissions and dedicated support.
We live and breathe the markets and are dedicated to helping traders realise their ambitions as we continue to set the industry bar.
Economic calendar
Web Trader platform
Our sophisticated web-based platform is packed with features.
Related articles
NZD/USD pressure mounts as payrolls looms large
NZD/USD has fallen sharply as Fed rate expectations reset higher, but extreme downside stretch and major support raise the risk of a violent counter-trend rebound.

US Core PCE Preview: Stale or Significant for the Fed
Core PCE inflation takes center stage Wednesday, with traders watching for signs of renewed price pressure and clues on whether the Fed could hike again in October.


Gold Forecast: Are Bears Regaining Control of XAU/USD?
The start of the trading week has not been particularly favorable for gold. This can be seen in recent XAU/USD price action, with the metal falling nearly 4.00% over the last two trading sessions and bringing renewed attention to a bearish bias within the market.

StoneX Europe Ltd may make third party material available on this website which may contain information included but not limited to the conditions of financial markets. The material is for information purposes only and does not contain, and should not be construed as containing, investment advice and/or investment recommendation and/or an investment research and/or an offer of or solicitation for any transactions in financial instruments; any decision to enter into a specific transaction shall be made by the client following an assessment by him/her of their situation.
StoneX Europe Ltd makes no representation or warranty and assumes no liability as to the accuracy or completeness of the information provided, nor any loss arising from any investment based on a recommendation, forecast or other information supplied. You should always seek independent advice as to your suitability to speculate in any related markets and your ability to assume the associated risks, if you are at all unsure. We are not under any obligation to update any such material. Any opinion made may be personal to the author and may not reflect the opinion of StoneX Europe Ltd.