





Whose employment data do you trust more ADP or ISM
Depending on your answer, it may give you a better expectation for NFP on Friday
Share this:

On Monday, the ISM Manufacturing PMI for July was worse than expected at 58.5 vs 60.6 in June. Although the headline number was lower, brought down primarily by the New Orders and Prices Paid components, the Employment component was stronger than expected and increased from 49.9 to 52.9! Today, ISM released then Non-Manufacturing PMI for July. The headline number was strong at 64.1 vs 60.5 expected and 60.1 in June. One of the reasons for this increase was due the Employment component, which rose to 53.8 vs 49.4 expected and 49.3 last. Therefore, both the ISM Manufacturing AND Non-Manufacturing PMIs had strong Employment components.
Also today, ADP released their private Employment Change for July. According to ADP, +330,000 private jobs were added to the economy, the lowest print since February. This was vs an estimate of +695,000 and June’s print of +680,000. Unsurprisingly, leisure and hospitality led the way with new jobs. Restaurants, nightclubs, hotels, and airlines have all seen higher demand for services, and the need for jobs to provide these services are reflected in this data.
So, the ISM data shows an increase in jobs for both Manufacturing and Non-Manufacturing. ADP shows a decrease in jobs from June (by a lot!), although the leisure and hospitality led the way. Whose data do you trust more? Depending on your answer, it may give you a better expectation for NFP on Friday. Current expectations for Non-Farm Payrolls on Friday are +885,000 jobs to be added to the economy for July vs 850,000 in June. (See out NFP Preview).
In addition, on Thursday the US releases Initial Jobless Claims for the week ending July 31st. Expectations are for 384,000. However, recall that for the last two weeks, the prints were higher than expected at 419,000 and 400,000 respectively. Expectations were for the mid/upper 300,000s for both weeks. Tomorrow’s number will be closely watched as Non-Farm Payrolls “whispers” may begin to change.
US Dollars (DXY) were sold today after the worse than expected ADP print. Although this hasn’t been a good indicator of NFP by itself, traders still went with the “Sell Dollars” theme, as they hoped this would indicate monetary stimulus for longer. However, after the stronger than expected ISM Non-Manufacturing PMI, the DXY was bought as traders feared stimulus would be lifted sooner than later. It seems like the markets don’t know the right answer!
Source: Tradingview, Stone X
As EUR/USD makes up a majority of the DXY, the pair did the exact opposite. EUR/USD went bid after the ADP release and sold off after the ISM Non-Manufacturing PMI release. At the top, price formed a nice evening star formation with the RSI in overbought territory. This gave traders a warning signal that price direction may be changing.
Source: Tradingview, Stone X
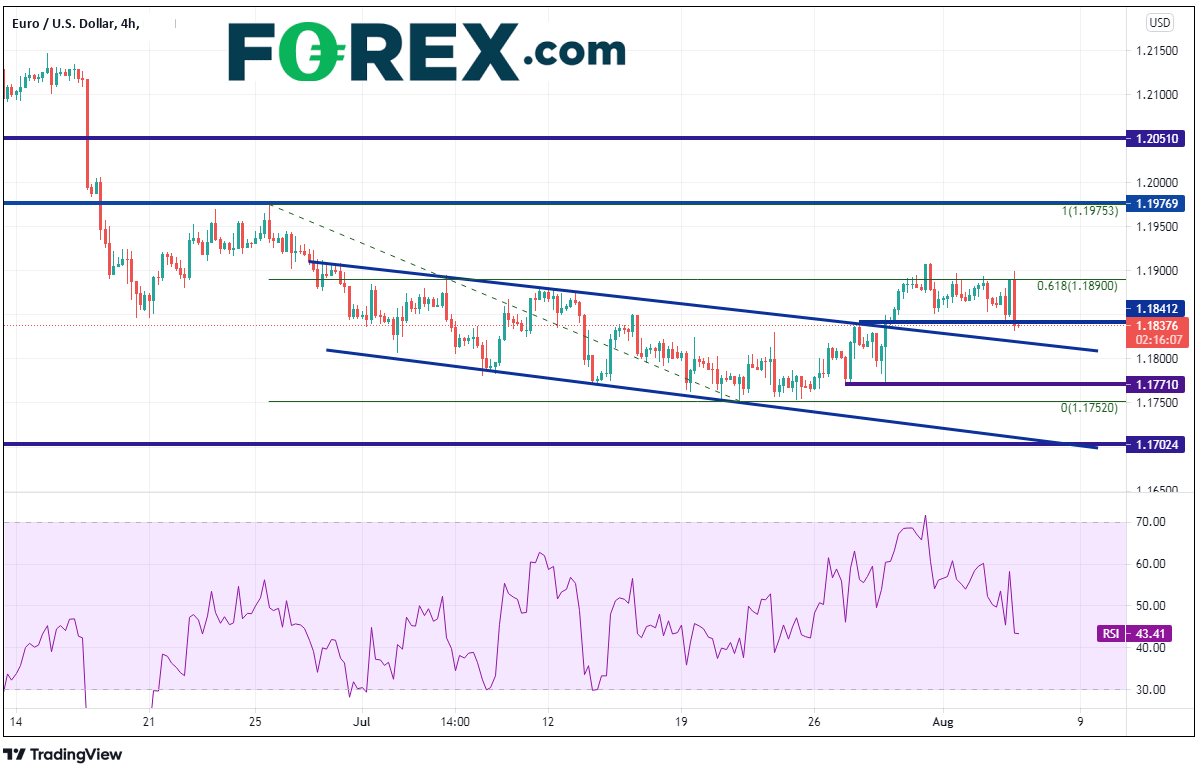
On a 240-minute timeframe, EUR/USD sold off aggressively in mid-June but failed to climb above 1.2000 since, putting in a high of 1.1976 on June 25th. The pair had been moving lower in an orderly channel during the month of July, reaching a low of 1.1750. However, on July 28th, EUR/USD broke above the top trendline of the channel but could not stay above the 61.8% Fibonacci retracement level from the June 25th highs to the July 20th lows. The most recent bar on the 240-minute timeframe is a bearish engulfing candlestick, an indication of a possible move lower. Support is at the downward sloping top trendline of the channel near 1.1820, then horizontal support at 1.1770. Resistance isn’t until today’s highs at 1.1900, just ahead of the highs of July 30th at 1.1909. If EUR/USD breaks above there, price can travel all the way up to the 1.1975 June 25th highs.
Source: Tradingview, Stone X
With stronger ISM Employment data and weaker ADP Employment data, it will be tough for traders to make a “guesstimate” of Friday’s NFP print. Throw in weaker Initial Jobless Claims, and “whispers” may begin, which are different from the current expectation of +895,000.
Learn more about forex trading opportunities.
On Monday, the ISM Manufacturing PMI for July was worse than expected at 58.5 vs 60.6 in June. Although the headline number was lower, brought down primarily by the New Orders and Prices Paid components, the Employment component was stronger than expected and increased from 49.9 to 52.9! Today, ISM released then Non-Manufacturing PMI for July. The headline number was strong at 64.1 vs 60.5 expected and 60.1 in June. One of the reasons for this increase was due the Employment component, which rose to 53.8 vs 49.4 expected and 49.3 last. Therefore, both the ISM Manufacturing AND Non-Manufacturing PMIs had strong Employment components.
Also today, ADP released their private Employment Change for July. According to ADP, +330,000 private jobs were added to the economy, the lowest print since February. This was vs an estimate of +695,000 and June’s print of +680,000. Unsurprisingly, leisure and hospitality led the way with new jobs. Restaurants, nightclubs, hotels, and airlines have all seen higher demand for services, and the need for jobs to provide these services are reflected in this data.
So, the ISM data shows an increase in jobs for both Manufacturing and Non-Manufacturing. ADP shows a decrease in jobs from June (by a lot!), although the leisure and hospitality led the way. Whose data do you trust more? Depending on your answer, it may give you a better expectation for NFP on Friday. Current expectations for Non-Farm Payrolls on Friday are +885,000 jobs to be added to the economy for July vs 850,000 in June. (See out NFP Preview).
In addition, on Thursday the US releases Initial Jobless Claims for the week ending July 31st. Expectations are for 384,000. However, recall that for the last two weeks, the prints were higher than expected at 419,000 and 400,000 respectively. Expectations were for the mid/upper 300,000s for both weeks. Tomorrow’s number will be closely watched as Non-Farm Payrolls “whispers” may begin to change.
US Dollars (DXY) were sold today after the worse than expected ADP print. Although this hasn’t been a good indicator of NFP by itself, traders still went with the “Sell Dollars” theme, as they hoped this would indicate monetary stimulus for longer. However, after the stronger than expected ISM Non-Manufacturing PMI, the DXY was bought as traders feared stimulus would be lifted sooner than later. It seems like the markets don’t know the right answer!
Source: Tradingview, Stone X
As EUR/USD makes up a majority of the DXY, the pair did the exact opposite. EUR/USD went bid after the ADP release and sold off after the ISM Non-Manufacturing PMI release. At the top, price formed a nice evening star formation with the RSI in overbought territory. This gave traders a warning signal that price direction may be changing.
Source: Tradingview, Stone X
On a 240-minute timeframe, EUR/USD sold off aggressively in mid-June but failed to climb above 1.2000 since, putting in a high of 1.1976 on June 25th. The pair had been moving lower in an orderly channel during the month of July, reaching a low of 1.1750. However, on July 28th, EUR/USD broke above the top trendline of the channel but could not stay above the 61.8% Fibonacci retracement level from the June 25th highs to the July 20th lows. The most recent bar on the 240-minute timeframe is a bearish engulfing candlestick, an indication of a possible move lower. Support is at the downward sloping top trendline of the channel near 1.1820, then horizontal support at 1.1770. Resistance isn’t until today’s highs at 1.1900, just ahead of the highs of July 30th at 1.1909. If EUR/USD breaks above there, price can travel all the way up to the 1.1975 June 25th highs.
Source: Tradingview, Stone X
With stronger ISM Employment data and weaker ADP Employment data, it will be tough for traders to make a “guesstimate” of Friday’s NFP print. Throw in weaker Initial Jobless Claims, and “whispers” may begin, which are different from the current expectation of +895,000.
Related tags:
Latest market news




The complete CFD trading experience
Award-winning platforms, competitive spreads, low commissions and dedicated support.
We live and breathe the markets and are dedicated to helping traders realise their ambitions as we continue to set the industry bar.
Economic calendar
Web Trader platform
Our sophisticated web-based platform is packed with features.
Related articles
Gold Outlook: XAU/USD hit hard as US yields, dollar resume ascent
A stronger dollar, surging front-end yields and renewed geopolitical tension have combined to push gold back towards key technical support.
EUR/USD weekly outlook: Oil, inflation and NFP in focus
After coming under significant pressure in recent weeks, the EUR/USD came off its lows to finish the week on a positive note on Friday, albeit with only a mild rebound. That was not enough to prevent the exchange rate falling for the third consecutive week, as the US dollar and bond yields rallied across the board.


USD/JPY Weekly Outlook: Payrolls loom as US rates remain the dominant driver
Strong US growth and hawkish Fed pricing continue to support USD/JPY, while intervention risk appears to be kicking in at lower levels
StoneX Europe Ltd may make third party material available on this website which may contain information included but not limited to the conditions of financial markets. The material is for information purposes only and does not contain, and should not be construed as containing, investment advice and/or investment recommendation and/or an investment research and/or an offer of or solicitation for any transactions in financial instruments; any decision to enter into a specific transaction shall be made by the client following an assessment by him/her of their situation.
StoneX Europe Ltd makes no representation or warranty and assumes no liability as to the accuracy or completeness of the information provided, nor any loss arising from any investment based on a recommendation, forecast or other information supplied. You should always seek independent advice as to your suitability to speculate in any related markets and your ability to assume the associated risks, if you are at all unsure. We are not under any obligation to update any such material. Any opinion made may be personal to the author and may not reflect the opinion of StoneX Europe Ltd.