




Why Bears May Want to Be Cautious on the Dollar Index Breakdown
The dollar index has broken down from a rising wedge pattern, but 98.00 may be the important level to watch.
Share this:

As has consistently been the case over the last couple of years, Friday’s US-China trade “breakthrough” may be less than initially meets the eye. While President Trump praised the agreement as a “love fest” between the US and China, Chinese press was more levelheaded, noting that nothing has even been signed yet.
At the end of the day, cooperation that allows China to buy more US agricultural goods (given the country’s food shortage) and the US to delay tariff escalation benefits both sides, but more contentious issues surrounding intellectual property and forced technology transfers could still torpedo a more comprehensive agreement in the coming months.
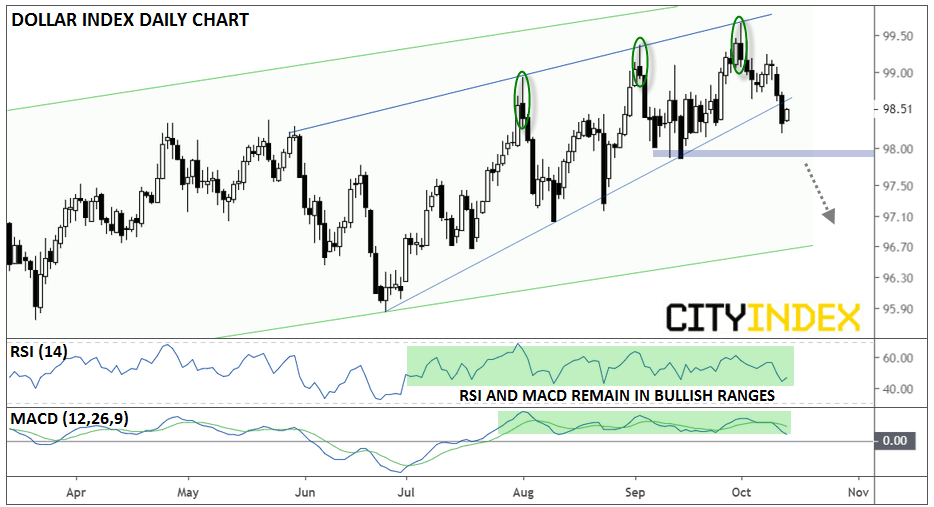
In any event, Friday’s risk-on trading session prompted traders to sell the greenback, prompting the US dollar index to break down from its four-month rising wedge pattern. Despite the seemingly bullish name, this price action pattern shows that buyers are struggling to push the price higher on each subsequent swing. It is a classic sign of waning buying pressure and often portends a bearish reversal:
Source: Trading View, City Index
While the price pattern itself is potentially bearish, readers may want to exercise some caution. For the momentum, the dollar index remains in a textbook uptrend (higher highs and higher lows) and neither the RSI nor MACD indicators have broken down from their recent bullish ranges.
For bears to truly feel comfortable pushing the greenback lower, they’d need to see the dollar index break below its September lows in the 97.90-98.00 range (the equivalent zone in EUR/USD is around 1.1090-1.1100). Unless or until we get a stronger technical signal, traders may want to keep a neutral outlook toward the US dollar generally, despite last week’s breakdown.
As has consistently been the case over the last couple of years, Friday’s US-China trade “breakthrough” may be less than initially meets the eye. While President Trump praised the agreement as a “love fest” between the US and China, Chinese press was more levelheaded, noting that nothing has even been signed yet.
At the end of the day, cooperation that allows China to buy more US agricultural goods (given the country’s food shortage) and the US to delay tariff escalation benefits both sides, but more contentious issues surrounding intellectual property and forced technology transfers could still torpedo a more comprehensive agreement in the coming months.
In any event, Friday’s risk-on trading session prompted traders to sell the greenback, prompting the US dollar index to break down from its four-month rising wedge pattern. Despite the seemingly bullish name, this price action pattern shows that buyers are struggling to push the price higher on each subsequent swing. It is a classic sign of waning buying pressure and often portends a bearish reversal:
Source: Trading View, FOREX.com
While the price pattern itself is potentially bearish, readers may want to exercise some caution. For the momentum, the dollar index remains in a textbook uptrend (higher highs and higher lows) and neither the RSI nor MACD indicators have broken down from their recent bullish ranges.
For bears to truly feel comfortable pushing the greenback lower, they’d need to see the dollar index break below its September lows in the 97.90-98.00 range (the equivalent zone in EUR/USD is around 1.1090-1.1100). Unless or until we get a stronger technical signal, traders may want to keep a neutral outlook toward the US dollar generally, despite last week’s breakdown.
Latest market news




The complete CFD trading experience
Award-winning platforms, competitive spreads, low commissions and dedicated support.
We live and breathe the markets and are dedicated to helping traders realise their ambitions as we continue to set the industry bar.
Economic calendar
Web Trader platform
Our sophisticated web-based platform is packed with features.
Related articles
GBP/USD forecast: US dollar surges as bonds implode
The US dollar continued to press higher deep into the European session, supported by the slump in the bond markets as yields broke out across the curve. Following the recent hawkish Fed rate hike, yield spreads between the US and the rest of the world has continually increased, and that motion continued today, helped in part by some forecast-beating US macro data and hawkish Fed commentary.
Australian Dollar Technical Outlook: AUD/USD Breakdown Threatens Deeper Correction 9 23 2026
AUD/USD remains under pressure after breaking key trend support, with the latest decline putting the focus on the next major downside pivot.


USD/JPY forecast: US dollar strengths amid hawkish Fed despite recent oil weakness
The US dollar has extended its gains this morning, even if oil prices finished lower for the fifth consecutive day yesterday. Oil prices have bounced back in this first half of today’s session, causing a bit of pressure on currencies that rely on energy imports such as the euro, pound, Swiss franc, and Japanese yen. But it was the dollar that was exerting the most pressure, amid hawkish FedSpeak. Meanwhile, European indices and precious metals were also under a bit of pressure amid the strength of the dollar.
StoneX Europe Ltd may make third party material available on this website which may contain information included but not limited to the conditions of financial markets. The material is for information purposes only and does not contain, and should not be construed as containing, investment advice and/or investment recommendation and/or an investment research and/or an offer of or solicitation for any transactions in financial instruments; any decision to enter into a specific transaction shall be made by the client following an assessment by him/her of their situation.
StoneX Europe Ltd makes no representation or warranty and assumes no liability as to the accuracy or completeness of the information provided, nor any loss arising from any investment based on a recommendation, forecast or other information supplied. You should always seek independent advice as to your suitability to speculate in any related markets and your ability to assume the associated risks, if you are at all unsure. We are not under any obligation to update any such material. Any opinion made may be personal to the author and may not reflect the opinion of StoneX Europe Ltd.