




WTI Crude Futures Downside Pressure Mounting
WTI Crude Futures (Dec) has dropped more than 3% so far in October, after plunging 5.6% last month...
Share this:

WTI Crude Futures (Dec) has dropped more than 3% so far in October, after plunging 5.6% last month.
The return of supply has piled pressure on oil prices, as oil field services company Baker Hughes' data showed that U.S. rotary rig count has increased to 287 as of October 23, since marking a historical low of 244 in mid-August.
Meanwhile, market sentiment was dampened by the stall in talks over a new U.S. stimulus package, and investors were also concerned with the spike in new COVID-19 cases in the U.S. and Europe.
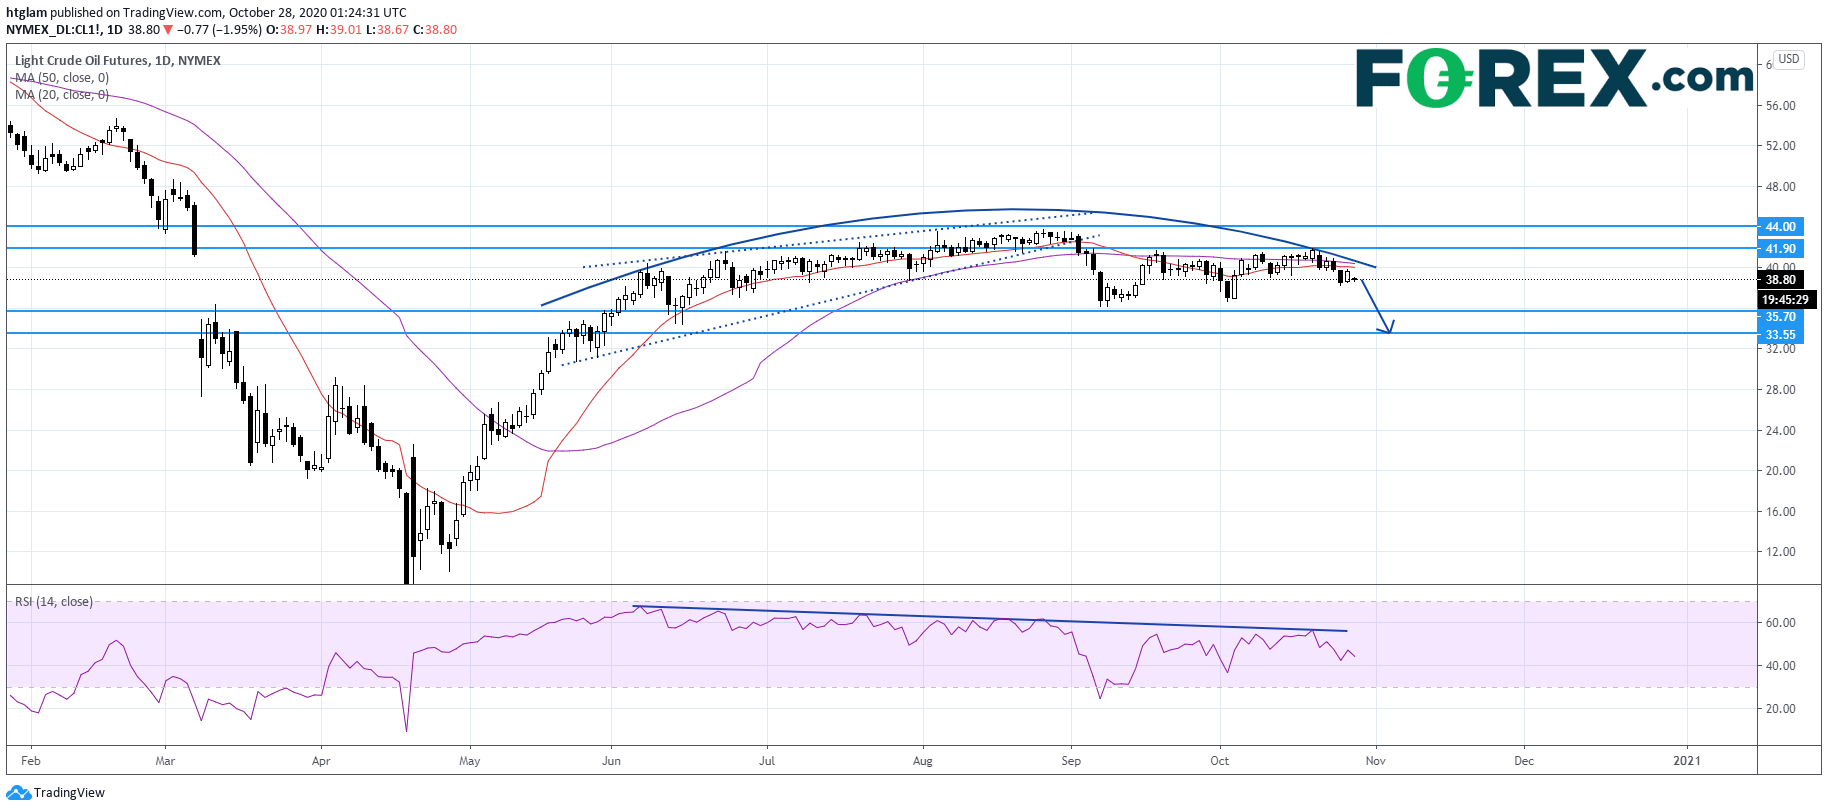
From a technical point of view, WTI Crude Futures' (Dec) pressure is mounting as shown on the daily chart. Previously, it has broken below a bearish rising wedge pattern and is now forming a rounding top pattern. The level at $41.90 might be considered as the nearest resistance, while the 1st and 2nd support are expected to be located at $35.70 and $33.55 respectively.
Source: Gain Capital, TradingView
WTI Crude Futures (Dec) has dropped more than 3% so far in October, after plunging 5.6% last month.
The return of supply has piled pressure on oil prices, as oil field services company Baker Hughes' data showed that U.S. rotary rig count has increased to 287 as of October 23, since marking a historical low of 244 in mid-August.
Meanwhile, market sentiment was dampened by the stall in talks over a new U.S. stimulus package, and investors were also concerned with the spike in new COVID-19 cases in the U.S. and Europe.
From a technical point of view, WTI Crude Futures' (Dec) pressure is mounting as shown on the daily chart. Previously, it has broken below a bearish rising wedge pattern and is now forming a rounding top pattern. The level at $41.90 might be considered as the nearest resistance, while the 1st and 2nd support are expected to be located at $35.70 and $33.55 respectively.
Source: Gain Capital, TradingView
Related tags:
Latest market news




The complete CFD trading experience
Award-winning platforms, competitive spreads, low commissions and dedicated support.
We live and breathe the markets and are dedicated to helping traders realise their ambitions as we continue to set the industry bar.
Economic calendar
Web Trader platform
Our sophisticated web-based platform is packed with features.
Related articles

S&P 500 Forecast: SPX rises after cooler-than-expected inflation data
U.S. stocks are rising and Treasury yields are falling after data showed that inflation increased at a cooler pace than expected, while U.S. consumer spending rose again in August.


Treasury Yields Lose Momentum as Energy ETF Retreats
The 10-year Treasury yield is testing a resistance zone respected since the 1920s, as bearish RSI divergence signals fading upside momentum.


GBP/USD, Oil Forecast: Two trades to watch 300926
GBP/USD: Can Stronger UK Growth Offset the Dollar’s Advantage? Oil: Supply Recovery Challenges the Geopolitical Premium.
StoneX Europe Ltd may make third party material available on this website which may contain information included but not limited to the conditions of financial markets. The material is for information purposes only and does not contain, and should not be construed as containing, investment advice and/or investment recommendation and/or an investment research and/or an offer of or solicitation for any transactions in financial instruments; any decision to enter into a specific transaction shall be made by the client following an assessment by him/her of their situation.
StoneX Europe Ltd makes no representation or warranty and assumes no liability as to the accuracy or completeness of the information provided, nor any loss arising from any investment based on a recommendation, forecast or other information supplied. You should always seek independent advice as to your suitability to speculate in any related markets and your ability to assume the associated risks, if you are at all unsure. We are not under any obligation to update any such material. Any opinion made may be personal to the author and may not reflect the opinion of StoneX Europe Ltd.