
The ASX 200 is threatening a break below 8900 after falling to a six-week low, with weakness across several highly correlated sectors adding to downside pressure. Options positioning and major moving averages highlight 8900 and 8850 as important support zones, while rising expectations for a September RBA hike remain another headwind.
View related analysis:
- AU GDP Unlikely to Derail RBA Hike, AUD/USD Eyes ISM, NFP
- FX Futures Positioning: Yen Shorts Built Ahead of Yen Surge | COT Report
- Japanese Yen Outlook: MOF Riding BOJ, Fed Momentum?
- How to Read the COT Report to Track Forex Market Sentiment
ASX 200 Tests 8900 as Sector Weakness Adds to Downside Risk
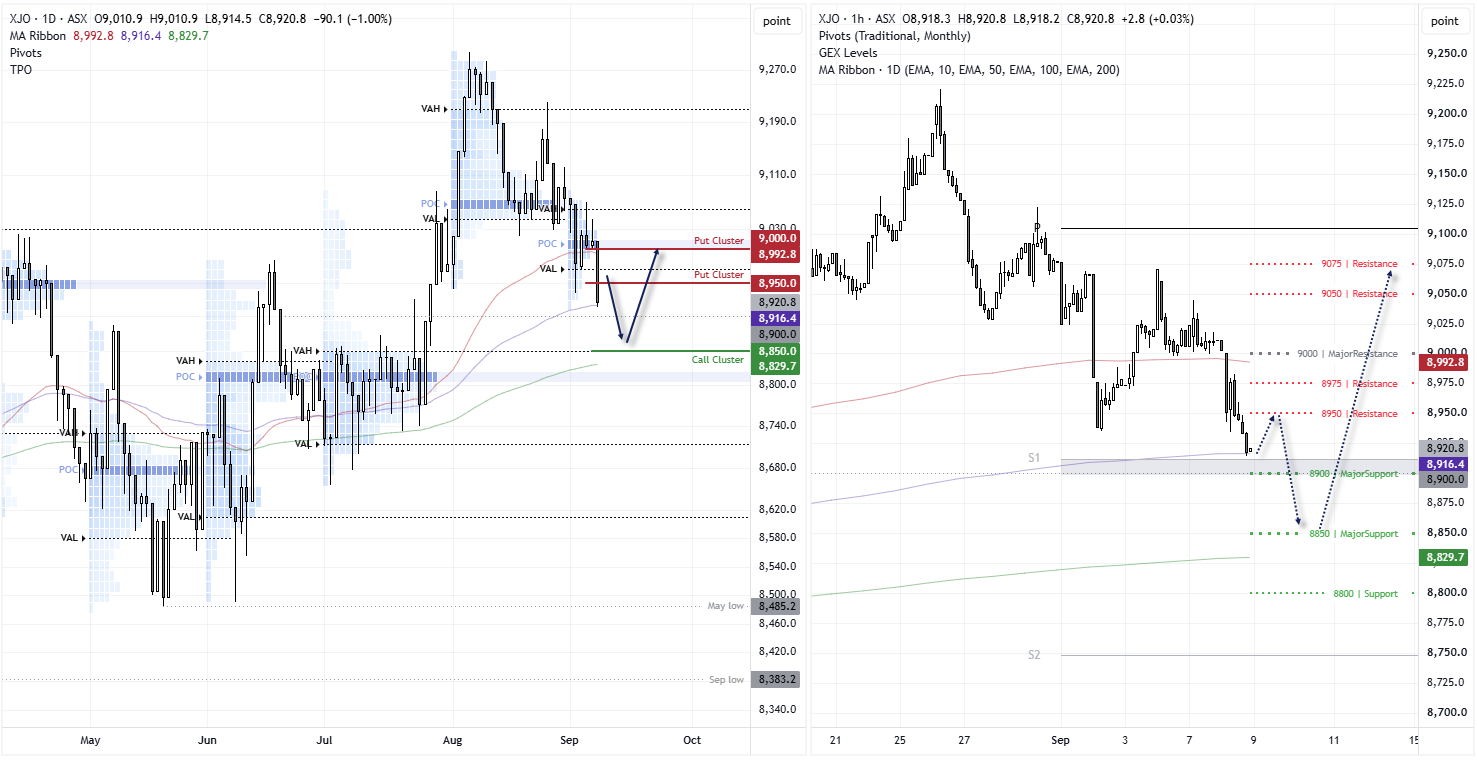
I had been seeking a swing low on the ASX 200 daily chart, though bears clearly dominated Tuesday’s session. Its 1% decline on the cash market saw the index close at a six-week low and within striking distance of the 8900 handle. With a weak lead from the S&P 500 and Dow Jones, an attack on 8900 seems plausible today.
However, the weekly S1 and 100-day EMA sit just above 8900, providing a potential support zone. Also note that the 200-day EMA sits just below 8850, which coincides with a strong cluster of call options and provides the next major support area if bears drive it lower today.
So I still see the potential for a swing low; it may just end up being closer to the 200-day EMA than I originally envisaged, with Middle East tensions continuing to escalate.
Source: ASX, TradingView
ASX 200 Options-Derived Levels: 8900 Support, 9000 Resistance
With the ASX 200 closing at 8920 and SPI futures pointing slightly higher, 8900 is the main support/pivot area. Next week’s positioning is also heavy around 8900, reinforcing its importance near the weekly S1 and 100-day EMA. A break below there brings 8850 into focus as the stronger downside support zone, where a call cluster also sits near the 200-day EMA. 8800 provides another deeper level of support.
On the upside, 8950–8975 is the first resistance zone, with tomorrow’s expiry showing put positioning clustered around those levels. That is followed by 9000, where next week’s options positioning is particularly large and could make it difficult for price to push cleanly through without stronger momentum. Above 9000, 9050–9075 is the next resistance area.

ASX 200 Correlations Highlight Tech and Materials Leadership
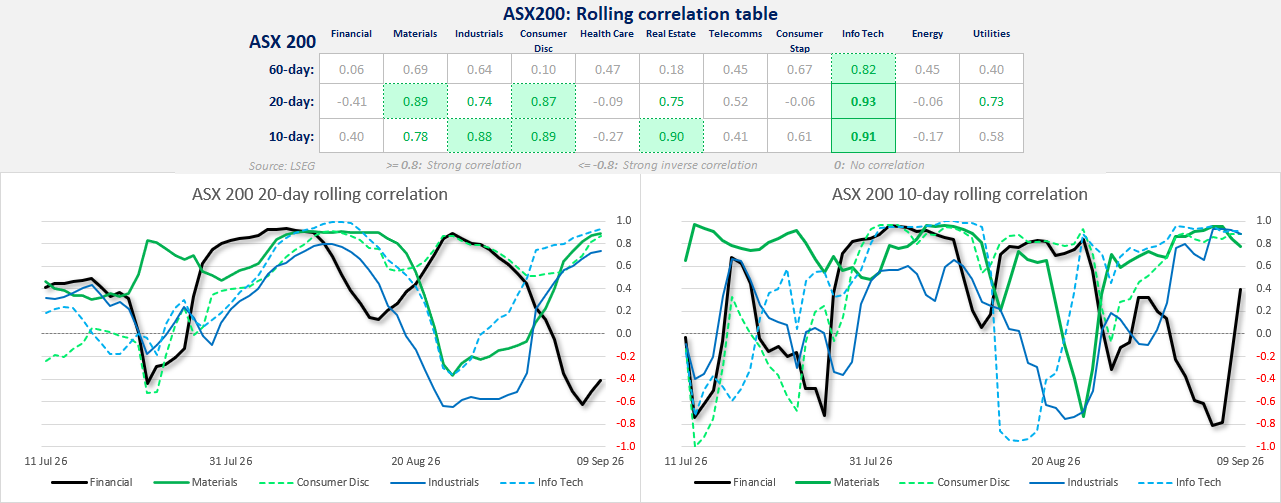
The financial sector has been out of sync with the ASX for a little while now, with correlations remaining relatively weak and unstable across the three timeframes. While the relationship with materials remains strong, the sector looks relatively overextended at its highs compared with price action elsewhere. So if the XMJ index rolls over, it could add further downside pressure to the ASX.
The strongest relationship across all three timeframes is with the information technology sector, with materials also maintaining a consistently strong correlation. Consumer discretionary has strengthened considerably over the shorter 10- and 20-day windows, while industrials and real estate are also highly correlated over 10 days. And with several major banks now calling for a September RBA hike, selling pressure on the ASX could persist over the near term without a fresh bullish catalyst.
Source: ASX, LSEG
ASX 200 Sector Charts Reinforce Downside Pressure
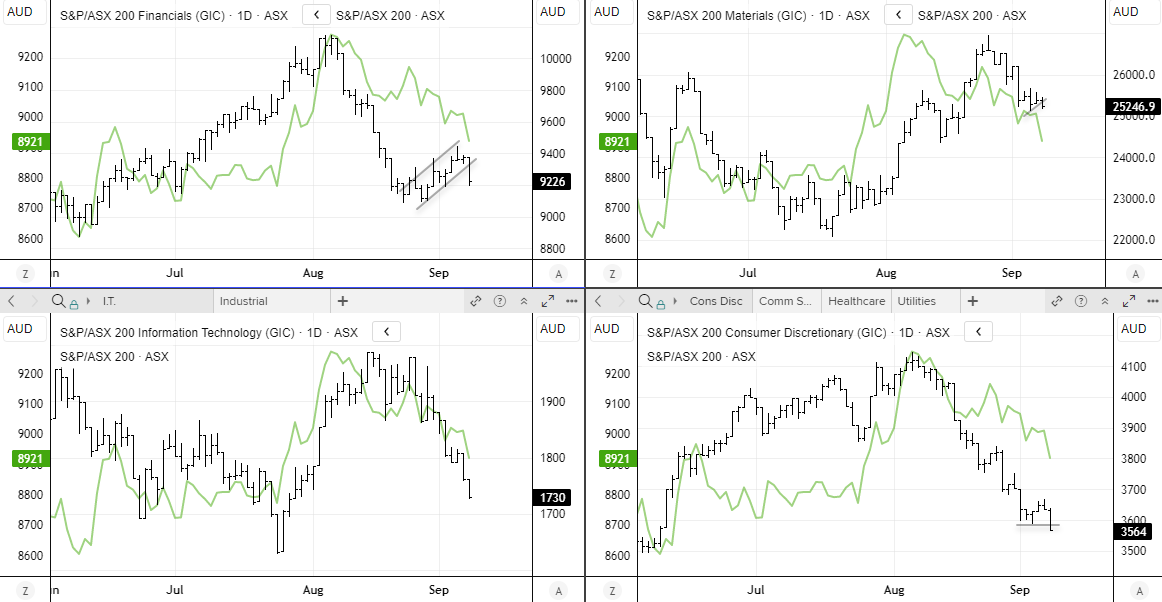
The sector charts reinforce the broader correlation picture, with information technology and consumer discretionary tracking the ASX particularly closely into the latest decline. Materials are also rolling over from recent highs, while financials remain the clear outlier.
Source: ASX, TradingView