



ASX 200 Market Outlook: Resistance Looms, Though GMG Bounce Shows Promise
The ASX 200 rebounds from volatile lows but faces resistance near key technical levels, while Graphene Manufacturing (GMG) attempts a bullish turnaround.
Share this:

The ASX 200 attempted to stabilise on Wednesday after a volatile start to the week, though the rebound may struggle to extend as key technical resistance looms overhead. At the same time, Graphene Manufacturing (GMG) has shown early signs of a potential turnaround following a sharp rebound from support.
View related analysis:
View related analysis:
ASX 200 Rebounds From Volatile Lows but Resistance Builds
ASX 200 Market Snapshot
- The ASX 200 managed to rise up to 1.7% by the day’s high on Wednesday, though closed up 1% to recoup some of its risk-off losses
- Daily trading volume was slightly below its 20-day average, suggesting the rebound was more of a relief from selling as opposed to initiative ‘risk-on’ buying
- The ASX has fallen as much as -8% from its record high, but has recovered 2.8% from this week’s volatile low set on Tuesday
- With expectations settling on a drawn-out war in Iran, it could cap gains for the local share market
- 9 of the 11 sectors advanced, led by technology (XIJ), materials (XMJ) and healthcare (XHJ), energy (XEJ) and consumer staples (XSJ) declined during the mild risk-recovery day
- SPI 200 futures were up 0.28% overnight, pulling back after meeting resistance around its 200-day EMA and now trading around its 200-day SMA
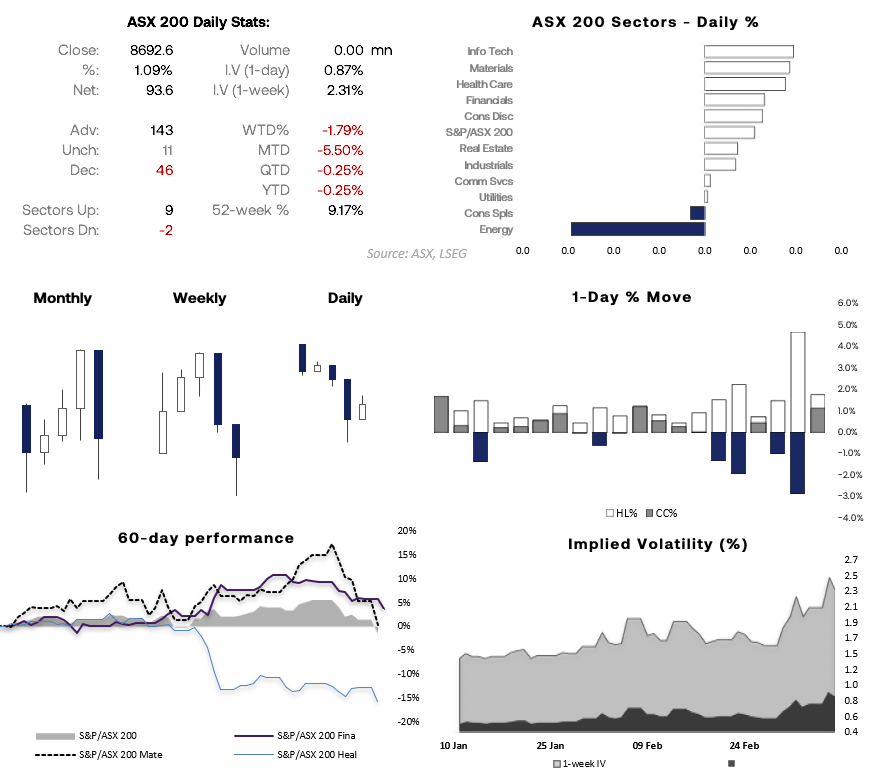
Source: ASX, LSEG


ASX 200 Technical Analysis
ASX 200 Options Positioning: 8,900 Reclaim Level as Downside Risk Extends Toward 8,600
Options positioning suggests the centre of gravity for the ASX 200 has shifted lower into Wednesday’s expiry. While the largest concentration of contracts sits around 8,900, that level now acts more as a reclaim level rather than a near-term magnet after the recent selloff. If the index attempts to rebound, resistance may emerge around 8,850–8,900, while near-term support appears around 8,775. A break below that level could expose the next meaningful downside level closer to 8,600, where larger put positioning sits.
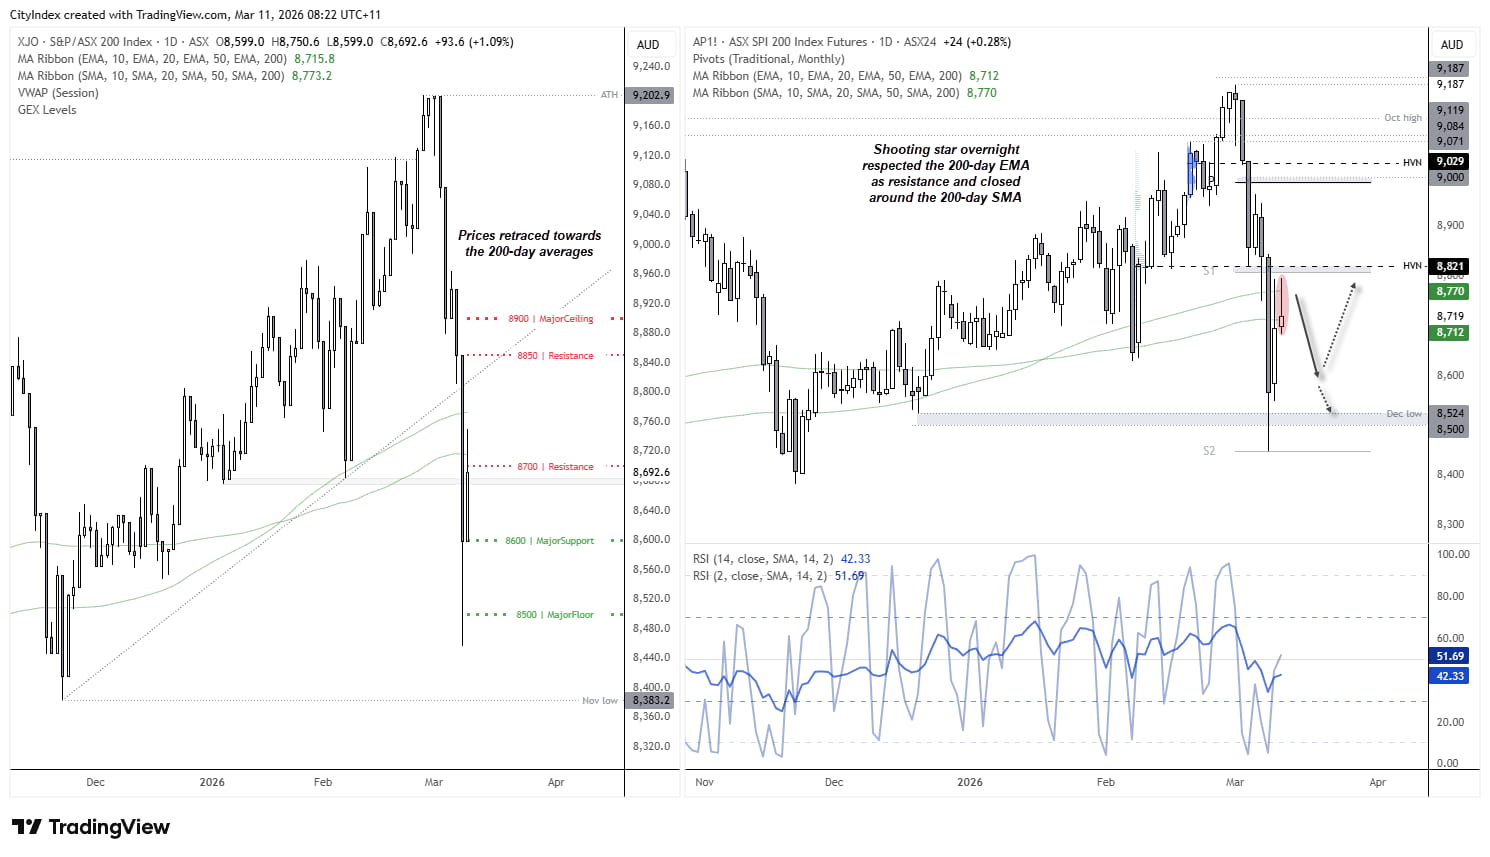
Source: ASX, ASX24, TradingView
SPI 200 Futures Reject Key Resistance Near 200-Day EMA
The SPI 200 (ASX 200 futures) chart on the right shows a shooting star candle formed overnight. Resistance was met just beneath a high-volume node (HVN), the monthly S1 pivot point, and around the 200-day EMA. Prices then retraced toward the 200-day SMA.
These are clearly important averages for the ASX over the near term, so unless the market receives a strong risk-on catalyst today, it seems more likely that bears may attempt to push prices lower while these upper resistance levels continue to hold.


Graphene Manufacturing (GMG) Technical Analysis
The 15.8% rally on Tuesday marked GMG’s strongest session in 28 trading days. The move followed a prolonged pullback, with the final three sessions forming narrow-ranged dojis — a pattern that often signals seller exhaustion. This suggests an important swing low may have formed just below the $2 handle, marking a higher low relative to the decline to $1.77.
It is also worth noting that the pullback held above the monthly S1 pivot, and GMG is now attempting to break back above the monthly pivot point, which could shift near-term momentum back in favour of bulls.
Bulls may look for dips within Tuesday’s range to improve the reward-to-risk ratio, targeting a move toward the $2.26 cycle high, which sits just below the monthly R1 pivot.
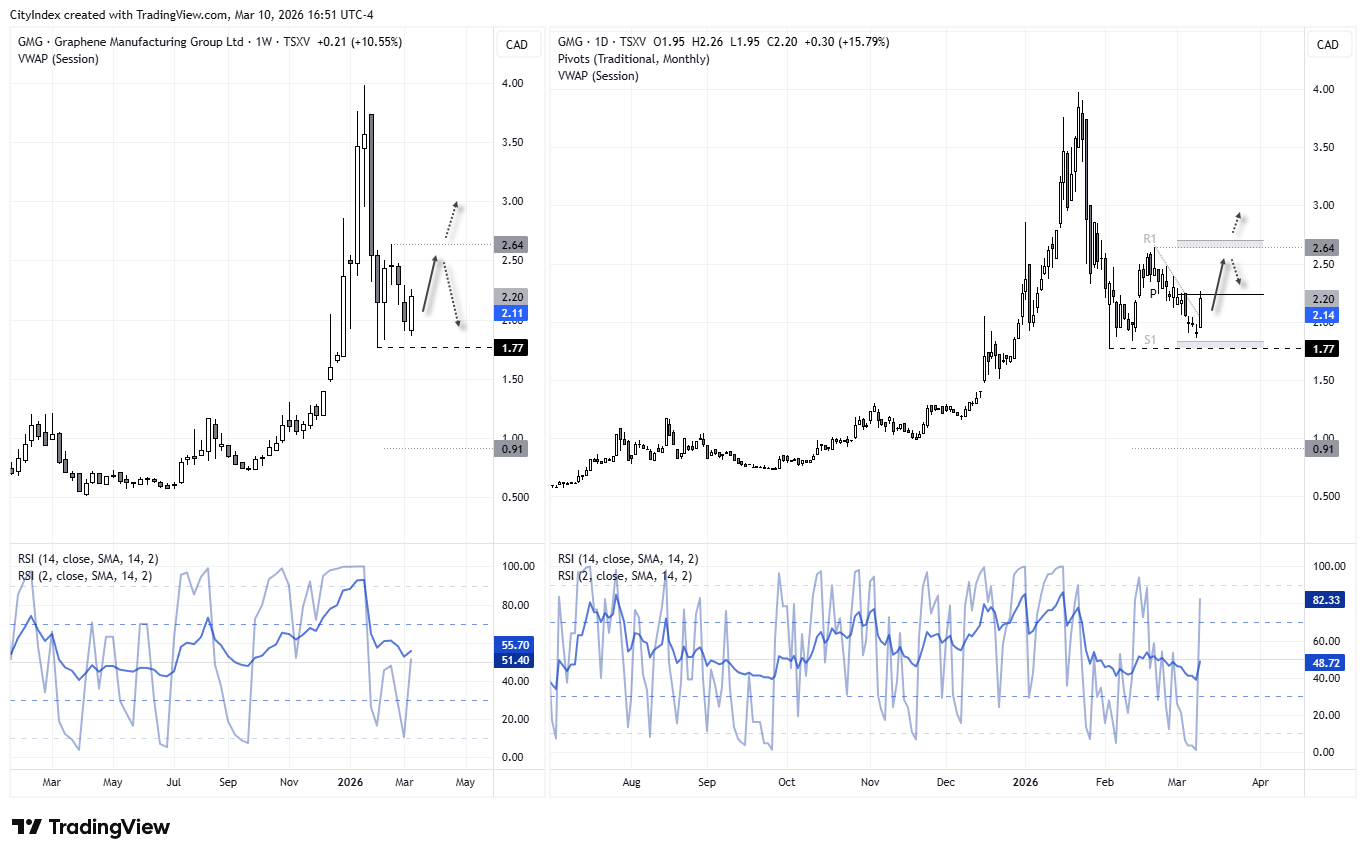
Source: ASX, ASX24, TradingView
View the full economic calendar
View the full economic calendar
-- Written by Matt Simpson
Follow Matt on Twitter @cLeverEdge
How to trade with City Index
You can trade with City Index by following these four easy steps:
- Open an account, or log in if you’re already a customer
• Open an account in the UK
• Open an account in Australia
• Open an account in Singapore
- Search for the market you want to trade in our award-winning platform
- Choose your position and size, and your stop and limit levels
- Place the trade
Related tags:
Latest market news




Open an account in minutes
Experience award-winning platforms with fast and secure execution.
Economic calendar
Web Trader platform
Our sophisticated web-based platform is packed with features.
Related articles
S&P 500, Nasdaq 100 Claw Back But NVDA Cloud Looms Overhead
Last week was green for both the Nasdaq and S&P 500 but given the sell-off that led into that bounce there’s still a very real question as to whether bears still have a statement to make. And the NVDA situation presents a very real threat.
Nvidia Earnings Preview: NVDA’s First Test of the Post Jenson Huang Era
Nvidia is expected to report $2.47 in EPS on $108.8B in revenue this quarter, but investors will be more interested in the company's guidance after the unexpected departure of founder and CEO Jenson Huang.


US dollar forecast: USD/JPY and USD/CHF in focus | Forex Friday
Sticky US inflation and a hawkish Fed have kept the dollar firm across the majors, with USD/JPY pressing on the 160 handle. Here are the levels that matter on USD/JPY and USD/CHF as next week's retail sales, Nvidia results and FOMC minutes approach.

The information on this web site is not targeted at the general public of any particular country. It is not intended for distribution to residents in any country where such distribution or use would contravene any local law or regulatory requirement. The information and opinions in this report are for general information use only and are not intended as an offer or solicitation with respect to the purchase or sale of any currency or CFD contract. All opinions and information contained in this report are subject to change without notice. This report has been prepared without regard to the specific investment objectives, financial situation and needs of any particular recipient. Any references to historical price movements or levels is informational based on our analysis and we do not represent or warranty that any such movements or levels are likely to reoccur in the future. While the information contained herein was obtained from sources believed to be reliable, author does not guarantee its accuracy or completeness, nor does author assume any liability for any direct, indirect or consequential loss that may result from the reliance by any person upon any such information or opinions.
Futures, Options on Futures, Foreign Exchange and other leveraged products involves significant risk of loss and is not suitable for all investors. Losses can exceed your deposits. Increasing leverage increases risk. Spot Gold and Silver contracts are not subject to regulation under the U.S. Commodity Exchange Act. Contracts for Difference (CFDs) are not available for US residents. Before deciding to trade forex, commodity futures, or digital assets, you should carefully consider your financial objectives, level of experience and risk appetite. Any opinions, news, research, analyses, prices or other information contained herein is intended as general information about the subject matter covered and is provided with the understanding that we do not provide any investment, legal, or tax advice. You should consult with appropriate counsel or other advisors on all investment, legal, or tax matters. References to FOREX.com or GAIN Capital refer to StoneX Group Inc. and its subsidiaries. Please read Characteristics and Risks of Standardized Options.