



ASX 200 Outlook: Bulls Buy Dips as RBA Hike Bets Collapse
The ASX 200 enjoyed its best day in six weeks as weak Australian jobs data crushed June RBA hike expectations.
Share this:

The ASX 200 posted its strongest daily gain in six weeks after weak Australian employment data sharply reduced expectations for another RBA rate hike. Falling yields and a positive lead from Wall Street helped lift sentiment, while technical signals suggest the index may be attempting to carve out a swing low near 8500.
View related analysis:
- Japanese Yen Outlook: USD/JPY Stalls While JPY Crosses Turn Choppy
- Crude Oil Outlook: Brent Teases Bears at Elevated Prices
- How to Read the COT Report to Track Forex Market Sentiment
- ASX 200 Outlook: SPI Futures Rebound, But Resistance Looms Into Expiry
- ASX 200 Outlook: ASX 200 Seeks Bounce Despite Rising Bearish Open Interest
View related analysis:
- Japanese Yen Outlook: USD/JPY Stalls While JPY Crosses Turn Choppy
- Crude Oil Outlook: Brent Teases Bears at Elevated Prices
- How to Read the COT Report to Track Forex Market Sentiment
- ASX 200 Outlook: SPI Futures Rebound, But Resistance Looms Into Expiry
- ASX 200 Outlook: ASX 200 Seeks Bounce Despite Rising Bearish Open Interest
ASX 200 Rebounds as Traders Slash RBA Hike Expectations
A positive lead from Wall Street and heavily reduced bets on a June RBA hike helped the ASX 200 enjoy its best day in six weeks. Bad news is clearly good news where the ASX is concerned, with weak employment figures crushing expectations for a 25bp hike to 4.6%, while some are even questioning whether the RBA’s modest 75bp tightening cycle has already peaked.
ASX 200 Market Snapshot
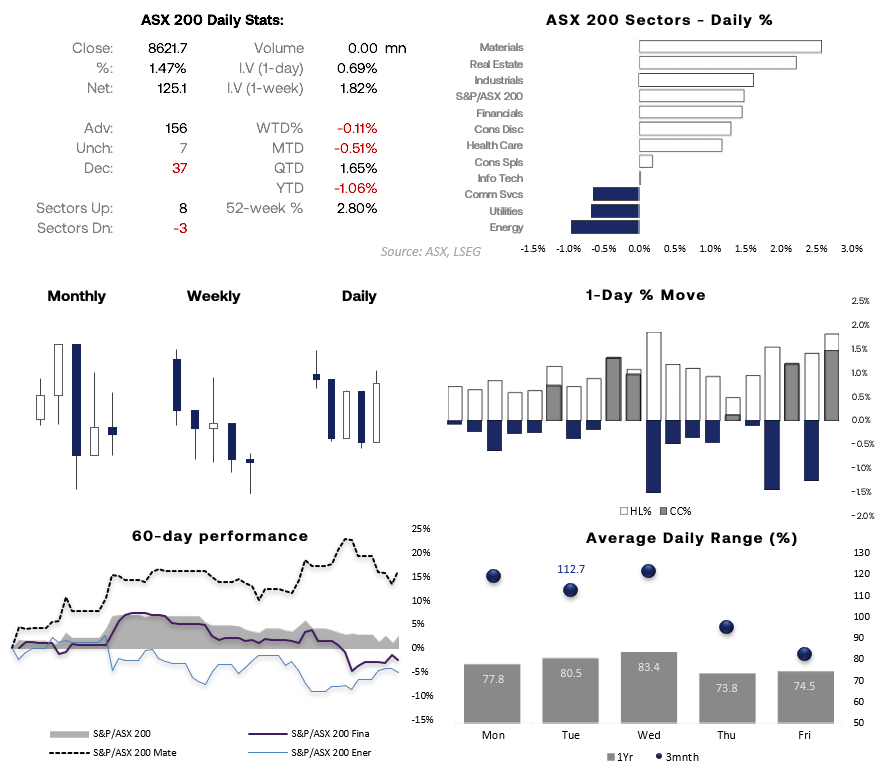
- 8 of the 11 sectors advanced, led by XMJ Materials (2.6%), XRE Real Estate (2.2%) and XNJ Industrials (1.6%)
- 156 stocks advanced (78%) with heavyweights such as BHP rising 3%, CBA up 0.9% though it was NAB which led the big four banks higher with its 2.3% gain
- GYG was the best performer, rising 13% to a 9-day high
- Wall Street has provided a positive lead overnight and SPU 200 futures were up 0.4%, hinting at a positive end to the week
Source: ASX, LSEG
ASX 200 Technical Analysis
ASX 200 Cash Index Signals Potential Swing Low
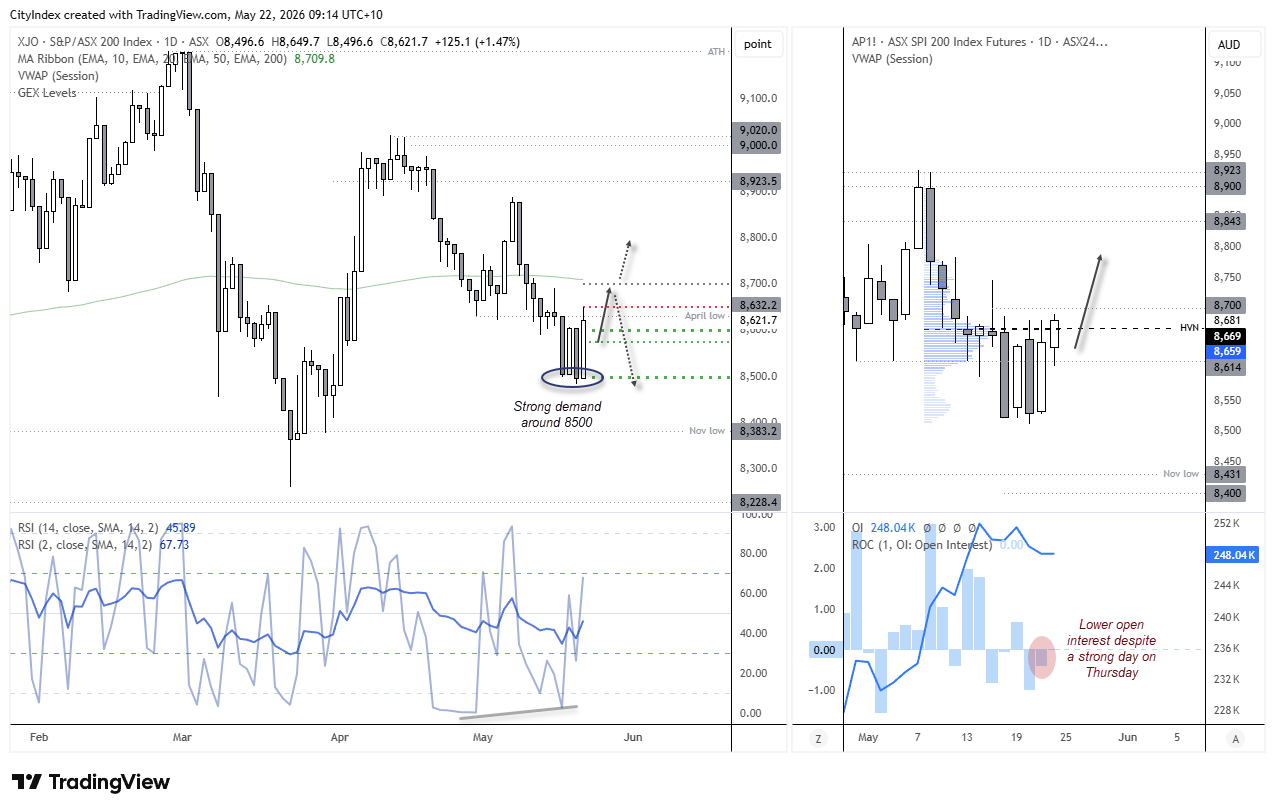
The daily cash market chart (left) shows a prominent bullish engulfing candle, using the 8500 options cluster as a springboard. A bullish divergence has formed on the daily RSI (2) within the oversold zone, further suggesting a swing low could be in place.
Given the positive lead from Wall Street, alongside reduced odds of further RBA hikes, I suspect the ASX 200 could rise further over the coming week — although I’m not expecting a runaway rally. A move towards 8700 could be on the cards, near the 200-day EMA.


SPI 200 Futures Open Interest Suggests Cautious Gains
SPI 200 (ASX 200 futures) shows that open interest has fallen over the past two days, which somewhat undermines the recent rebound. Hence the call for cautious gains. However, with prices back above the high-volume node, dips within Thursday’s range could appeal to bulls seeking a positive end to the week or a stronger start to next week.
Source: ASX, TradingView
ASX 200 Daily, 4-Hour Chart
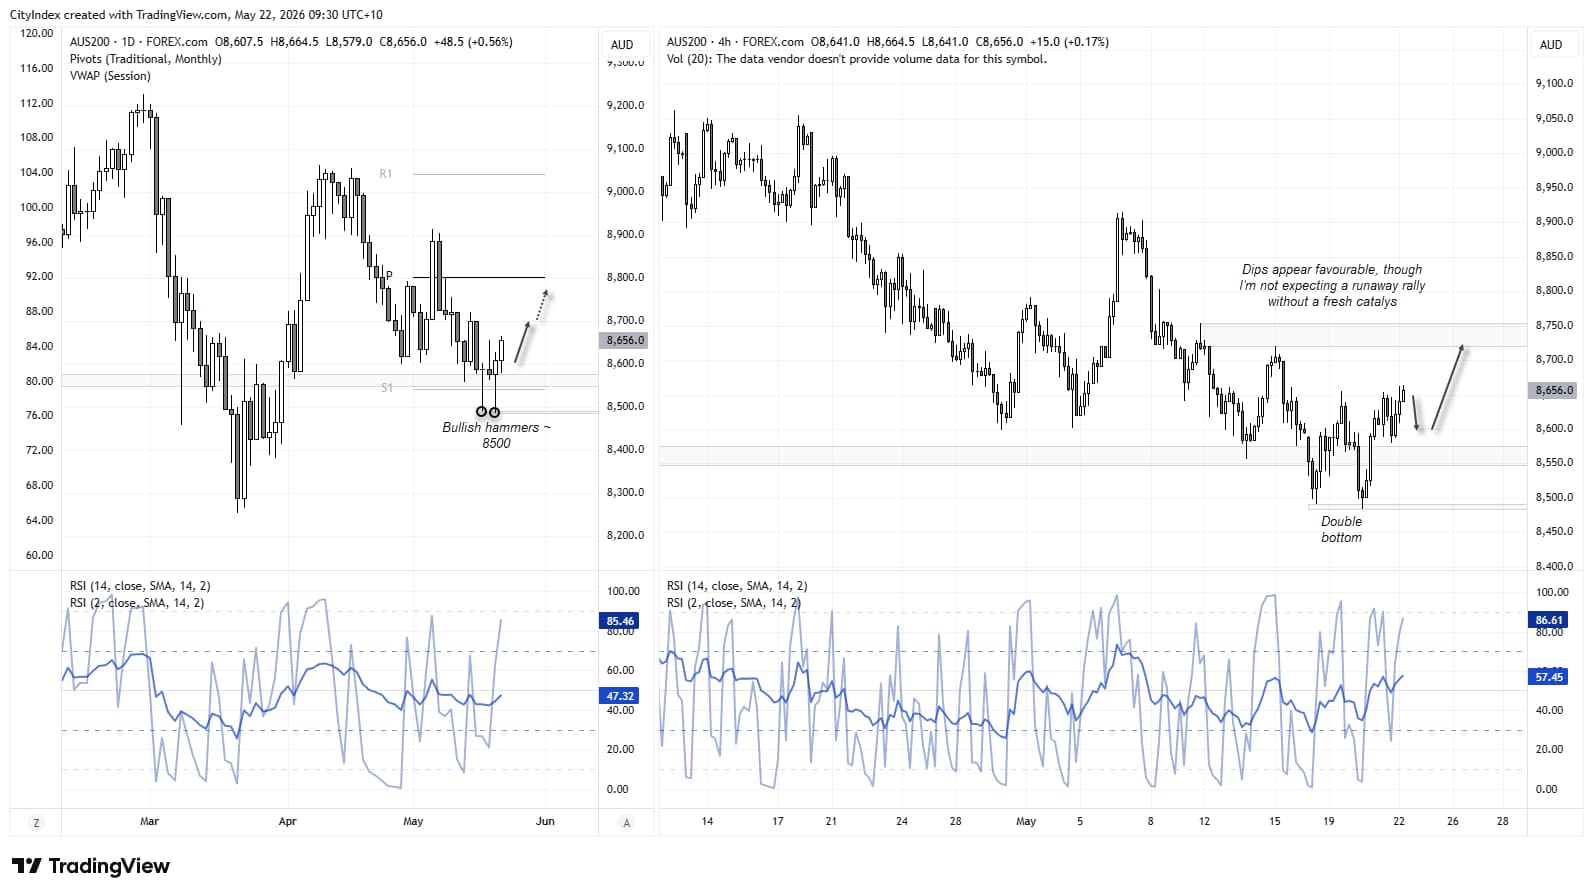
The daily chart shows a double bottom formed around 8500 on the 4-hour chart, which translates to two bullish hammers on the daily timeframe. Both candles marked false breaks of the monthly pivot point before closing back above it and a historical support and resistance zone.
Momentum is now pointing cautiously higher, although I would prefer to see pullbacks towards 8600 before reconsidering longs. Hopefully, a move towards the prior swing highs around 8720 to 8760 is on the cards.
Source: ASX, TradingView
View the full economic calendar
View the full economic calendar
-- Written by Matt Simpson
Follow Matt on Twitter @cLeverEdge
How to trade with City Index
You can trade with City Index by following these four easy steps:
- Open an account, or log in if you’re already a customer
• Open an account in the UK
• Open an account in Australia
• Open an account in Singapore
- Search for the market you want to trade in our award-winning platform
- Choose your position and size, and your stop and limit levels
- Place the trade
Related tags:



Open an account in minutes
Experience award-winning platforms with fast and secure execution.
Economic calendar
Web Trader platform
Our sophisticated web-based platform is packed with features.
Related articles
Gold Outlook: Asia Buys the Dip, US Hammers the Rip
Asia buys the dip, the US sells the rip. Hourly gold, dollar and Treasury yield data reveal a regional divide that has become especially pronounced since September.

S&P 500, Nasdaq 100 Claw Back But NVDA Cloud Looms Overhead
Last week was green for both the Nasdaq and S&P 500 but given the sell-off that led into that bounce there’s still a very real question as to whether bears still have a statement to make. And the NVDA situation presents a very real threat.

US dollar forecast: USD/JPY and USD/CHF in focus | Forex Friday
Sticky US inflation and a hawkish Fed have kept the dollar firm across the majors, with USD/JPY pressing on the 160 handle. Here are the levels that matter on USD/JPY and USD/CHF as next week's retail sales, Nvidia results and FOMC minutes approach.

The information on this web site is not targeted at the general public of any particular country. It is not intended for distribution to residents in any country where such distribution or use would contravene any local law or regulatory requirement. The information and opinions in this report are for general information use only and are not intended as an offer or solicitation with respect to the purchase or sale of any currency or CFD contract. All opinions and information contained in this report are subject to change without notice. This report has been prepared without regard to the specific investment objectives, financial situation and needs of any particular recipient. Any references to historical price movements or levels is informational based on our analysis and we do not represent or warranty that any such movements or levels are likely to reoccur in the future. While the information contained herein was obtained from sources believed to be reliable, author does not guarantee its accuracy or completeness, nor does author assume any liability for any direct, indirect or consequential loss that may result from the reliance by any person upon any such information or opinions.
Futures, Options on Futures, Foreign Exchange and other leveraged products involves significant risk of loss and is not suitable for all investors. Losses can exceed your deposits. Increasing leverage increases risk. Spot Gold and Silver contracts are not subject to regulation under the U.S. Commodity Exchange Act. Contracts for Difference (CFDs) are not available for US residents. Before deciding to trade forex, commodity futures, or digital assets, you should carefully consider your financial objectives, level of experience and risk appetite. Any opinions, news, research, analyses, prices or other information contained herein is intended as general information about the subject matter covered and is provided with the understanding that we do not provide any investment, legal, or tax advice. You should consult with appropriate counsel or other advisors on all investment, legal, or tax matters. References to FOREX.com or GAIN Capital refer to StoneX Group Inc. and its subsidiaries. Please read Characteristics and Risks of Standardized Options.