The ever-so dovish BOJ allowed risk to extend its Santa’s Rally on Tuesday, and for AUD/JPY to get very close to testing a key resistance zone around 99. Whilst I see the potential for it to test this area as we head into January, I remain unconvinced it will simply break above it given the significance of the level. If anything, it could pull back as Santa’s rally fizzles out and the Christmas hangovers weigh on the ‘buy anything’ optimism we appear to be seeing right now.
Still, whilst the RBA do not appear to be on track to hike rates again soon (if at all), the central bank remains relatively hawkish compared with the ultra-dovish BOJ. AUD/JPY is benefitting from the positive yield differential between the two base rates, alongside Santa’s rally which allows risk assets such as the Australian dollar benefit.
In fact, a closer look at its average daily returns in December shows that AUD/JPY tends to generate up days more than 50% of the time between December 20th through to 27th. Most notably is Boxing day with the highest positive average return and second highest win rate of 76.2%.

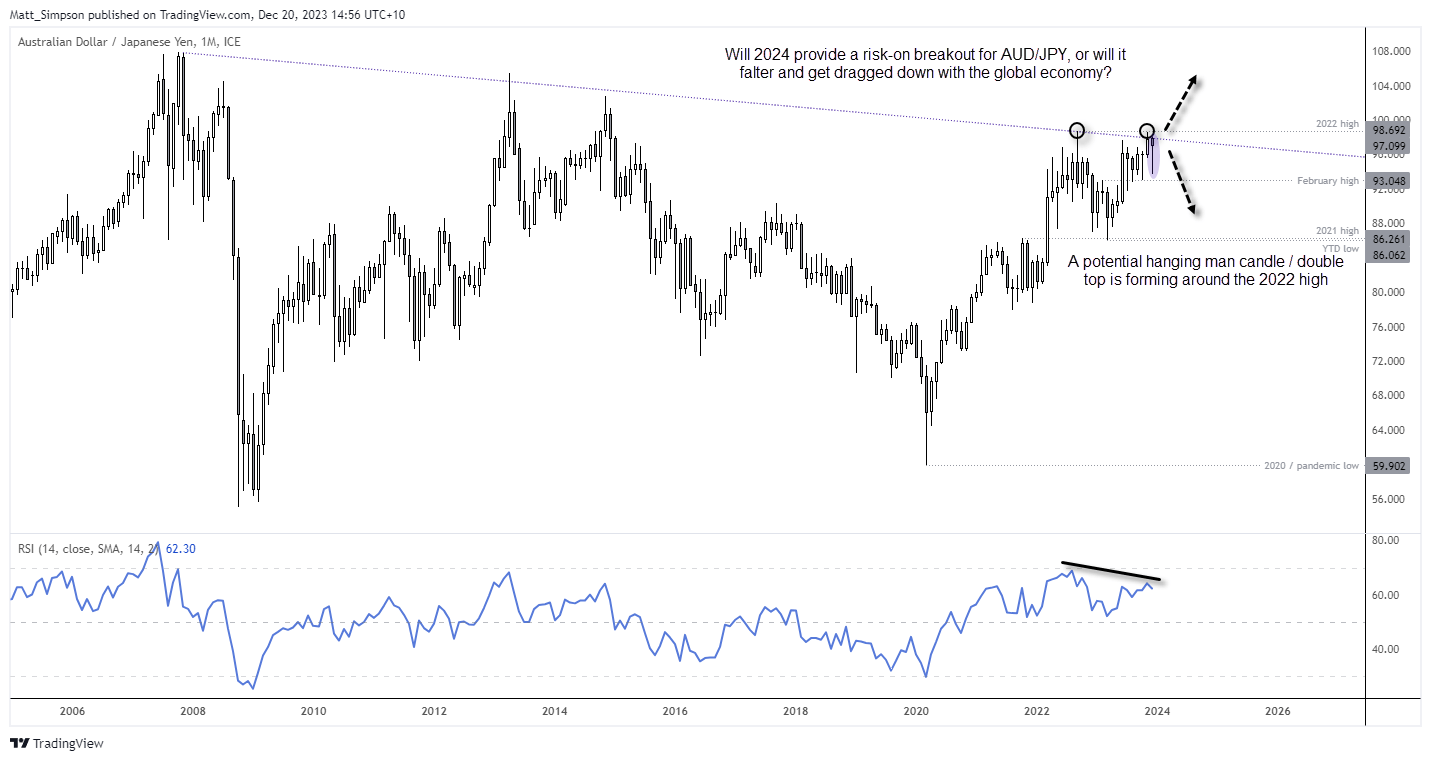
AUD/JPY technical analysis (monthly chart):
The Aussie yen rose an impressive 64.8% from the March 2020 low to 2022 high. The rally met a spurious trendline before retreating, but I have decided to keep it up and the November monthly candle closed almost perfectly on it to show the markets do seem to be watching it.
I think the biggest question this timeframe leaves with me is whether we’ll see a break above the 2022 high next year, or have we seen the early stages of an almighty double top? Because each scenario requires a very different landscape.
If US equities extend their rallies next year as the global economy skips any sort of landing yet inflation is also tamed, then yes we could very well see a breakout on AUD/JPY due to a risk-on environment. But if the wheels of the global economy fall off and we finally enter the much-telegraphed recession, then AUD/USD is a classic candidate to roll over from key resistance levels and at least produce a deep pullback.
And whilst AUD/JPY has a positive expectancy heading into the new year, take note that its current candle formation is of a hanging man at a key resistance level. This also coincides with a bearish divergence on the RSI 14.
AUD/JPY technical analysis (weekly chart):
Thanks to the BOJ standing pat, AUD/JPY enjoyed its best day in four months on Tuesday. The strong single-day rally could even be enough to label the trendline break as false given it broke swiftly above a prior cycle high to warn of a bullish trend change on the daily timeframe.
But can it now simply break to new highs? If Santa’s rally can maintain its gravity-defying momentum then perhaps it can at least test the 2022 high, but I would be surprised to see it simply break and hold above the 99 handle. Therefore, I have a cautious bullish bias for the remainder of the month, which will be quickly binned at the first sign of a bearish momentum shift around these highs (such as bearish engulfing candles).

AUD/JPY technical analysis (1-hour chart):
Bulls could seek evidence of if a swing low around the daily pivot point for a long towards 98 – a level which houses the daily R1 pivot and high-volume node from the prior decline. Alternatively, bulls could seek a break above the current consolidation, although this diminishes the reward to risk ratio.

-- Written by Matt Simpson
Follow Matt on Twitter @cLeverEdge