Ahead of the FOMC rate decision, markets were all over the place, as traders largely sat on their hands and awaited the release the Fed’s policy statement and hear from Chairman Kevin Warsh. Still disappointed from yesterday’s news that the CLARTY Act, a digital-asset market-structure bill, failed to clear the threshold required to advance to full Senate consideration, crypto traders were not in the mood to buy the dip. But what are the charts telling us?
Bitcoin technical analysis
Well, the chart of Bitcoin is not looking particularly promising after it ended weeks of consolidation with a breakdown yesterday. The clue for the breakdown came when bitcoin made a failed attempt to break higher in early September when that key $80K-$82K resistance held and that triggered some unwinding of longs, leading to an eventual drop below support near $76.2K. This level was being tested now from underneath at the time of writing.
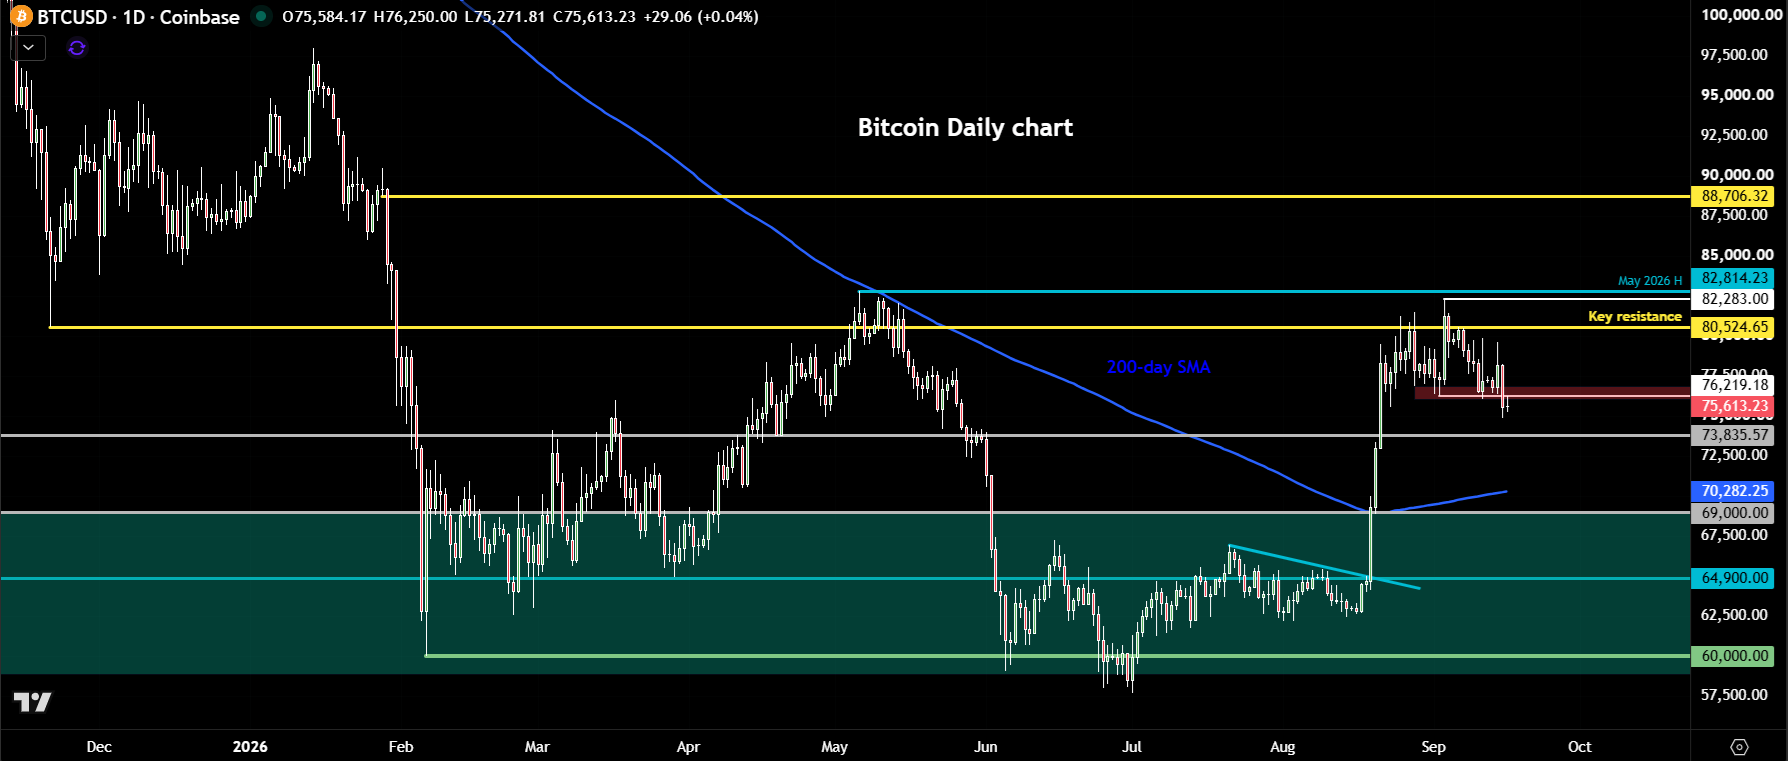
Yesterday saw Bitcoin completely give up Monday’s entire gains and some. At one point on Monday, it looked like the cryptocurrency was about to stage a breakout when it rallied above $79K, but here it ran into some resistance later on in that session, leading to a pullback from the highs.
For now, it has found some support around $75K to 75.5K area. Still, with recent price action being a little bearish, I wouldn't be surprised to see the selling pressure resume later on in the day.
Key levels to watch on BTC/USD
Should BTC/USD go below the $75,000 psychologically important level, there's not much in the way of obvious support until all the way around the 200-day moving average of $70,200/300 area. So, there is a possibility for a sharp correction to around the 200-day, if not more, FOMC permitting.
Alternatively, if Bitcoin now forms a bullish reversal candle on a closing basis, then that could be an early indication that finally it is ready to break higher because it has been stuck inside this chop zone and major resistance below $80,000 - $82,800 for a number of weeks. For confirmation, a clear break above this important technical zone is needed to form a higher high. If that happens, it would be a major bullish development. For the time being though the path of each resistance remains to the downside.