

There was little question as to which side was in control of USD/CAD as the month of March wound down. After spending almost half of Q1 building support around the 1.3500 level, buyers took control in a big way for three weeks in late-March, setting a fresh 2026 high on the final day of Q1 as buyers stalled just inside of the 1.4000 psychological level.
For the past week, however, that trend has been going in the other direction and the past four days have seen decisive selling backed by hope for resolution around Iran. Price is fast approaching a spot of potential support around the 1.3800 handle, but it’s the 1.3727 level that really stands out as this was a double bottom last year before setting up an ascending triangle formation in February and through March of this year – holding several resistance tests before finally giving way.
USD/CAD Daily Chart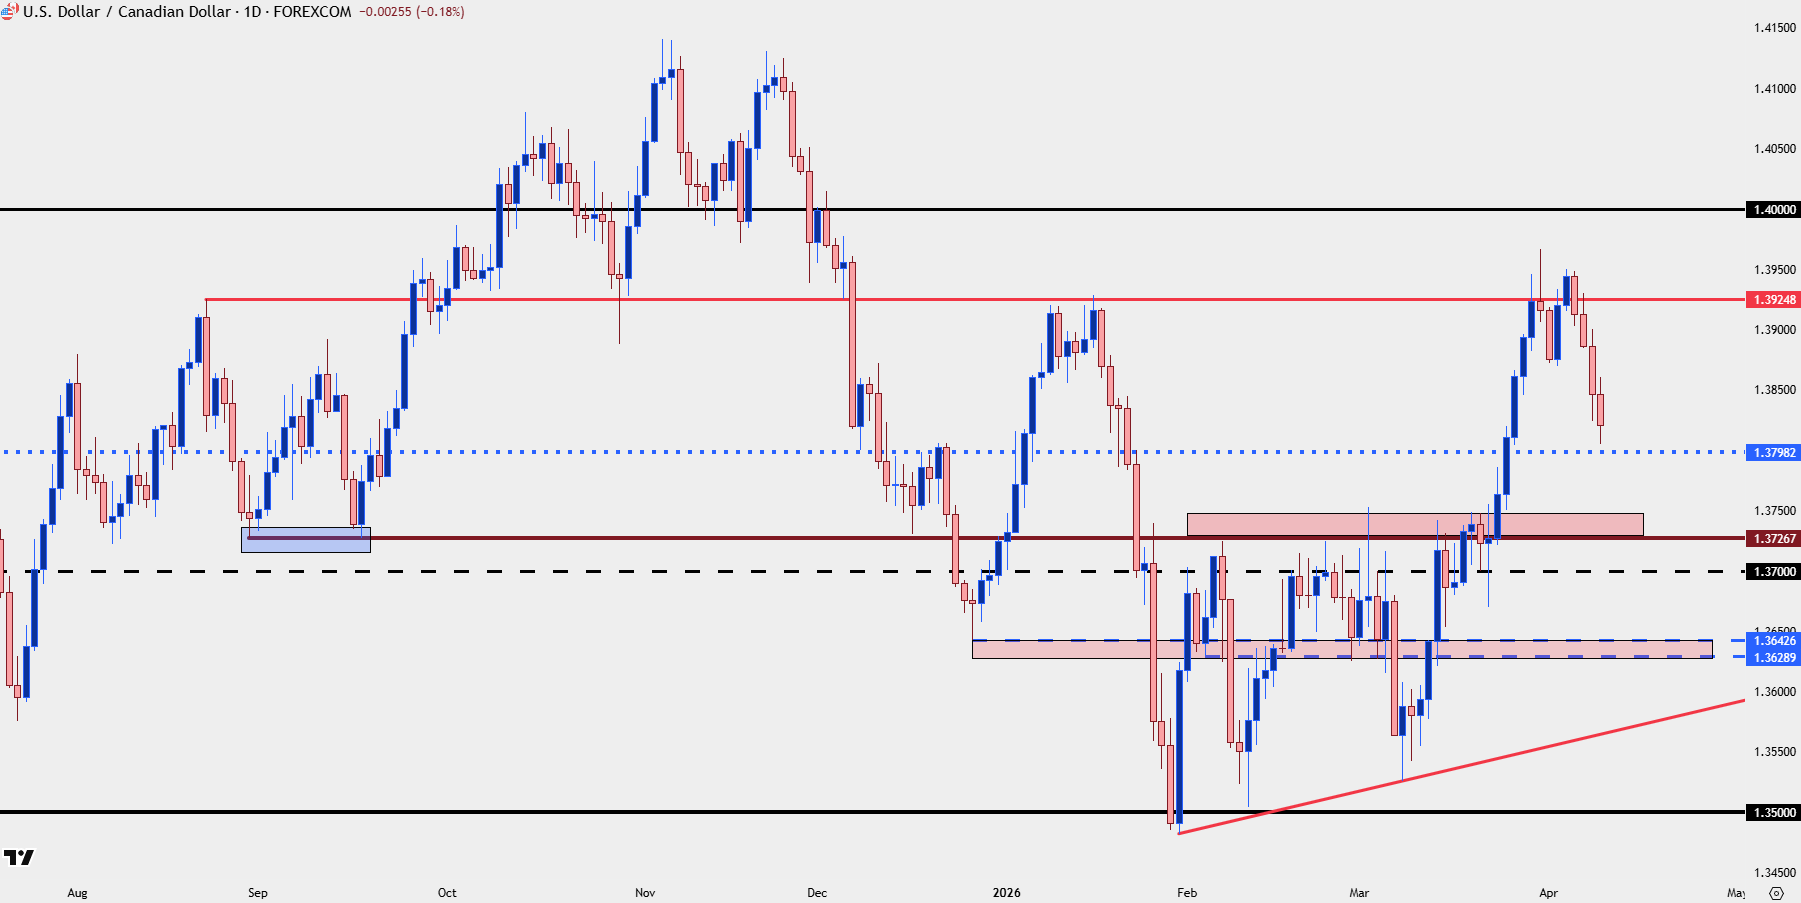
Chart prepared by James Stanley; data derived from Tradingview
USD/CAD Weekly
The weekly chart highlights the mean reverting nature of the past few months, and this also highlights the importance of the 1.3700-1.3727 area as this prior spot of resistance serves as somewhat of a mid-point for that range. A hold there keeps the door open for a bounce and for traders looking for USD-strength setups, this stands out as an attractive option given that structure.
USD/CAD Weekly Price Chart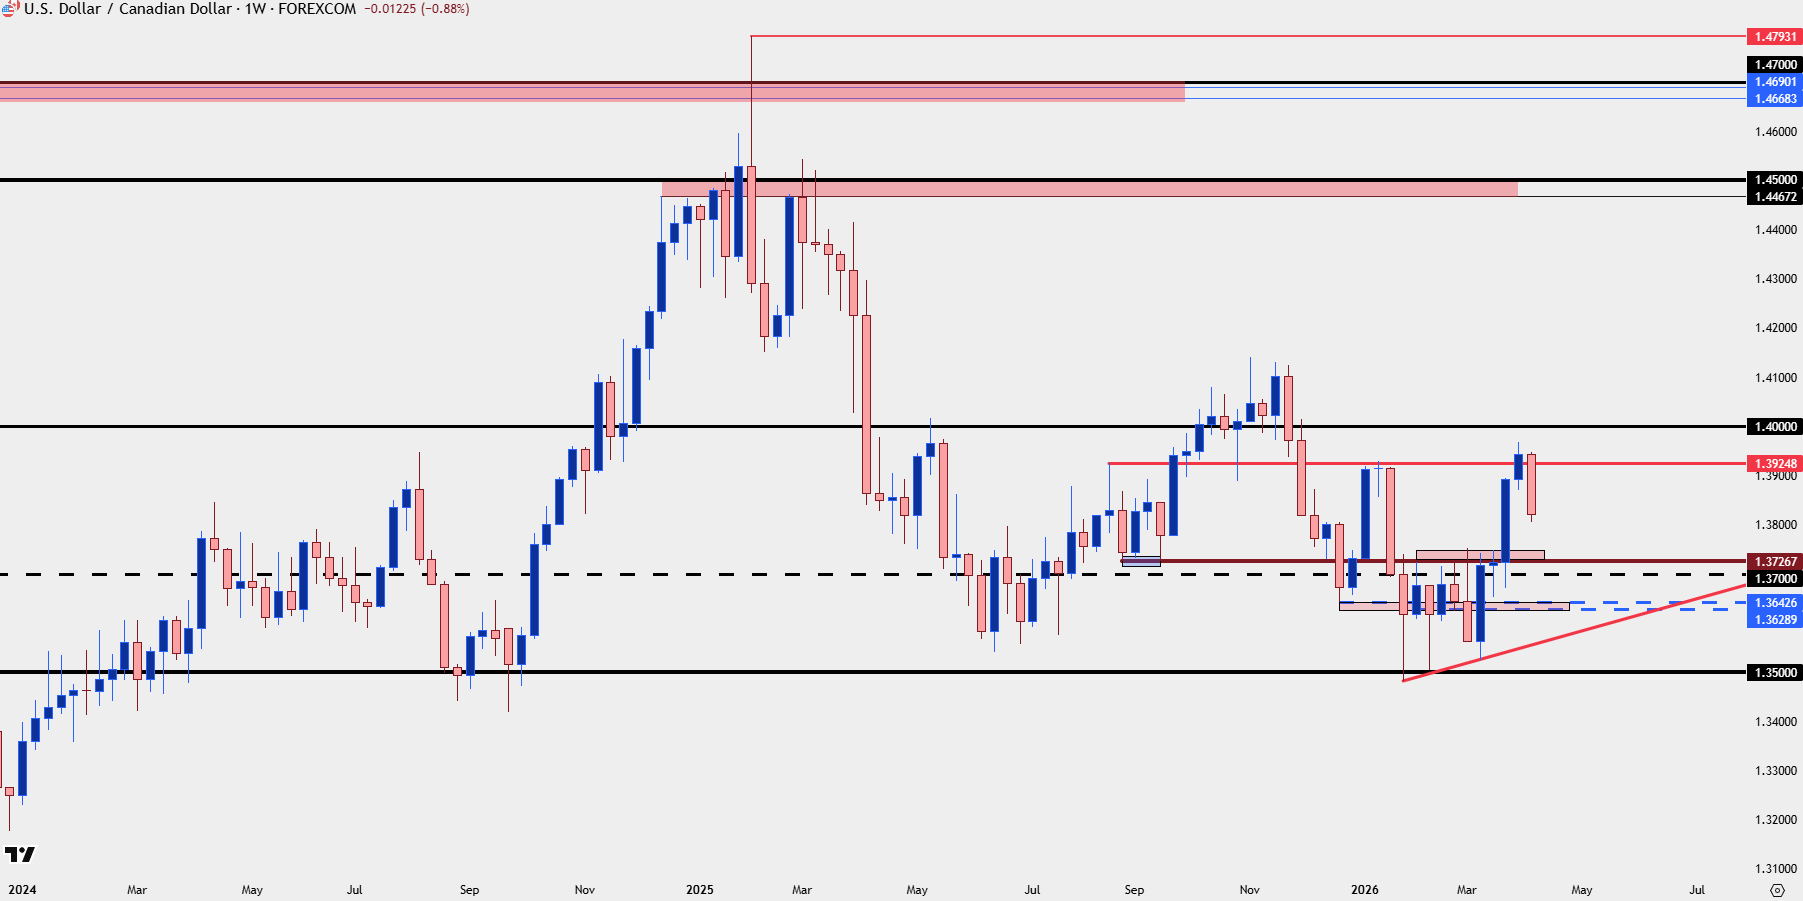
Chart prepared by James Stanley; data derived from Tradingview
--- written by James Stanley, Senior Market Analyst, Global Macro