





Canadian Dollar Forecast: USD/CAD Pandemonium on Trump Tariffs
It was a busy week and it looks like it’ll be a busy weekend, as well, with 25% tariffs set to go in-effect from the United States on Canada. This could lead to a volatile open on Sunday in the pair.
Share this:

USD/CAD, Canadian Dollar Talking Points
- With a few hours to go in the week and the month of January, it’s been a wild and chaotic ride in USD/CAD as the tariff topic has dominated the headlines.
- Initially, Trump said that tariffs would go into effect on ‘day one,’ which he walked back shortly after inauguration day and, instead, pointed to February 1st.
- He pledged on Thursday that tariffs were set to come online this weekend, but a report on Friday indicated that the date would be pushed back to March 1st, which brought a sizable retracement to USD/CAD. That report was then refuted by the White House a couple hours later, saying that tariffs were, in fact, scheduled to come into play on the originally revised deadline of February 1st.
- This is a fluid topic and there will likely be more twists and turns ahead, which can continue to stoke volatility across markets. USD/CAD could be vulnerable to chaotic swings on Sunday based on how the tariff theme develops over the weekend, and traders should exercise caution with the pair.
Markets are getting a warm reminder of market volatility under President Trump, when a simple social media comment or a remark to the press could cause a swell of buying or selling; and that showed on both sides in USD/CAD over the past week which extends a topic that’s been getting headlines for a couple of months.
At this point, there’s quite a bit that’s still uncertain and given the February 1st deadline being on a Saturday, this could have a large impact on markets on the Sunday open, USD/CAD included. So traders should exercise caution in the pair as this remains a very fluid situation that could change quickly; but from the past week and, bigger picture, over the past two months, a couple of key drives have been clear. Tariffs at this point have tended towards U.S. Dollar strength and Canadian Dollar weakness, with strength showing in the USD/CAD pair. A delay in tariffs or any thought of tariffs not coming into play has shown the opposite, with USD/CAD weakness.
On a shorter-term basis we can see this dynamic in action in both directions over the past couple weeks. Trump had previously said that tariffs on Canada would come into effect on ‘day one’ of his administration. So, the day after he was inaugurated, USD/CAD spiked above 1.4500, albeit temporarily. President Trump then pointed to February 1st as the date for tariffs to begin and USD/CAD continued to pullback until 1.4300 came into play, at which point buyers came into show support.
The next week-and-a-half was largely higher-lows, as buyers continued to build in the expectation for tariffs to begin on February 1st, and then on Thursday (January 30th), when President Trump indicated that tariffs were, in fact, coming online on Saturday, USD/CAD tested another breakout to a fresh four-year-high.
That breakout pared back later on Thursday and price continued to hover around 1.4500. But then a report hit on Friday indicating that Trump’s administration would again delay tariffs on Canada, and a larger pullback showed with the pair pushing below the 1.4400 handle.
It was a couple hours after that when the White House walked back that report, saying that the Reuters report of delaying until March 1st was incorrect.
USD/CAD then jumped again to test above the 1.4500 level. This is some chaotic volatility late in the session on Friday, and I’ve added a box around the gyration that began on Thursday to illustrate just how erratic those moves have been. But – perhaps more importantly – given the generally low levels of liquidity that will show on a Sunday open combined with the fact that this very fluid situation will likely remain in the headlines, this could make for a very volatile open in the USD/CAD pair.
USD/CAD Hourly Price Chart
 Chart prepared by James Stanley, USD/CAD on Tradingview
Canadian Tariffs: What’s Known, What Isn’t?
Perhaps the lack of details is what drove the Friday report that tariffs would be delayed, but at this point, there’s a lot left to be announced. What we do know is that the White House stated that 25% tariffs will be levied on imports from Canada and Mexico, and 10% tariffs on goods from China. White House press secretary Karoline Leavitt said that more details would be available on Saturday, while also making the statement, ‘these are promises made and promises kept by the president,’ which seems to indicate that the White House will not be backing down.
There’s also the question as to whether there will be a carve out for energy imports to the United States, as tariffs on oil could provide more push on inflation given the U.S. dependency on crude oil for transporting products across the continental 48 states.
And then there’s the question of retaliation, as Trudeau warned that Canada would respond to tariffs. To this point, threats from Canadian politicians ranging from Trudeau to candidate and former BoE Governor Mark Carney to the premier of Ontario, Doug Ford, have generally been met with more Canadian Dollar weakness, highlighting the fact that a larger trade war between the two countries could equation to even higher prices in USD/CAD.
There's also been the pledge of 'pandemic-level support' for workers in Canada should the U.S. impose tariffs. This would likely spell even more Canadian Dollar weakness as debt would probably be required to accomplish that initiative. And this could further drive USD/CAD topside breakouts.
And, on a bigger picture basis, that CAD-weakness could be even more troublesome for the Canadian economy as it pushes-higher on inflation, even as the Bank of Canada has been cutting rates as they did again last week.
So, this is a tenuous situation and President Trump certainly seems to think he’s holding the Trump card, pun intended, which has allowed for him to push the tariff topic closer and closer to reality.
From a strategy perspective, this can make for a dangerous backdrop for chasing breakouts, as there’s been several false breakouts that have appeared. However, for those exercising patience and waiting for support with a higher-low to show, there could be more attraction, such as we’ve seen since the initial breakout on the tariff topic, which then led to a pullback and support at the 1.4000 handle.
USD/CAD Daily Chart
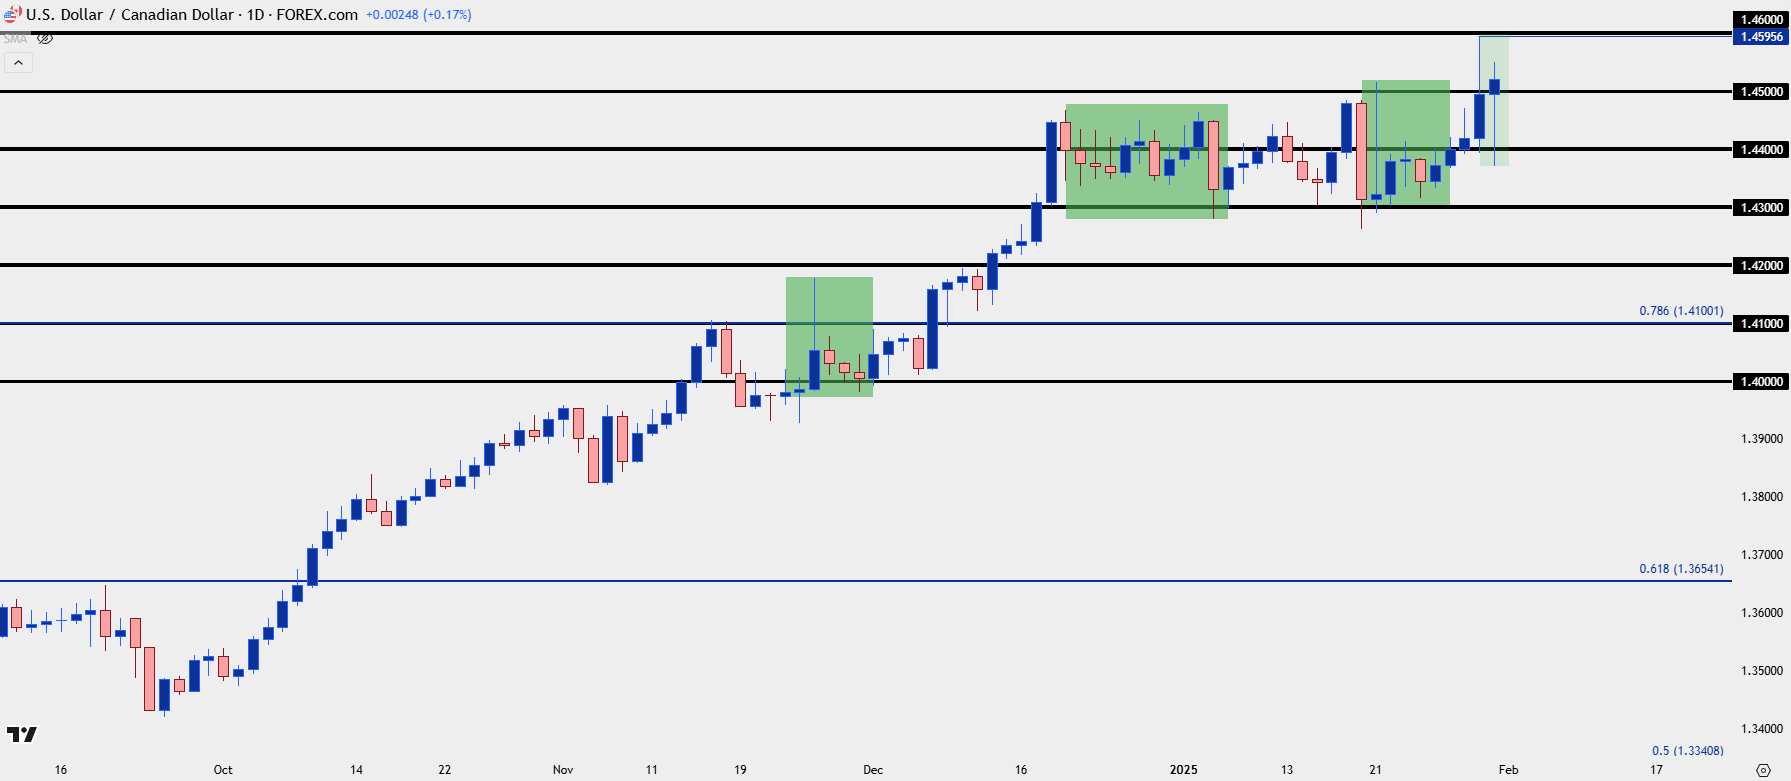 Chart prepared by James Stanley, USD/CAD on Tradingview
USD/CAD Bigger Picture
While the trend on the daily has been clear and running higher, longer-term there’s still the possibility of mean reversion, and price is getting closer and closer to a key juncture on the chart.
In 2020, the swing high came in at 1.4668, just 22 pips inside of the 2015 high of 1.4690. As I’ve been writing about for the past few months, that area marks the top-end of the range that’s held in USD/CAD and until bulls force a decisive move beyond that price, the possibility of mean-reversion remains.
From the monthly chart below bulls have remained in firm control ever since support at 1.3500 in September, and the January candle is shaping up to be bullish, as well. But the big question here on a longer-term basis if whether we see some form of pivot this month and given the hot button nature of the tariff topic, something like that would certainly seem possible. But, likely, we would need to see politicians on both sides of the matter move towards some element of resolution which, at this point, seems a distant prospect.
Until then, the next major resistance sitting overhead is clear at the 1.4690, above which the pair would push up to fresh 20-plus year highs.
USD/CAD Monthly Price Chart
 Chart prepared by James Stanley, USD/CAD on Tradingview
--- written by James Stanley, Senior Strategist
USD/CAD, Canadian Dollar Talking Points
- With a few hours to go in the week and the month of January, it’s been a wild and chaotic ride in USD/CAD as the tariff topic has dominated the headlines.
- Initially, Trump said that tariffs would go into effect on ‘day one,’ which he walked back shortly after inauguration day and, instead, pointed to February 1st.
- He pledged on Thursday that tariffs were set to come online this weekend, but a report on Friday indicated that the date would be pushed back to March 1st, which brought a sizable retracement to USD/CAD. That report was then refuted by the White House a couple hours later, saying that tariffs were, in fact, scheduled to come into play on the originally revised deadline of February 1st.
- This is a fluid topic and there will likely be more twists and turns ahead, which can continue to stoke volatility across markets. USD/CAD could be vulnerable to chaotic swings on Sunday based on how the tariff theme develops over the weekend, and traders should exercise caution with the pair.
Markets are getting a warm reminder of market volatility under President Trump, when a simple social media comment or a remark to the press could cause a swell of buying or selling; and that showed on both sides in USD/CAD over the past week which extends a topic that’s been getting headlines for a couple of months.
At this point, there’s quite a bit that’s still uncertain and given the February 1st deadline being on a Saturday, this could have a large impact on markets on the Sunday open, USD/CAD included. So traders should exercise caution in the pair as this remains a very fluid situation that could change quickly; but from the past week and, bigger picture, over the past two months, a couple of key drives have been clear. Tariffs at this point have tended towards U.S. Dollar strength and Canadian Dollar weakness, with strength showing in the USD/CAD pair. A delay in tariffs or any thought of tariffs not coming into play has shown the opposite, with USD/CAD weakness.
On a shorter-term basis we can see this dynamic in action in both directions over the past couple weeks. Trump had previously said that tariffs on Canada would come into effect on ‘day one’ of his administration. So, the day after he was inaugurated, USD/CAD spiked above 1.4500, albeit temporarily. President Trump then pointed to February 1st as the date for tariffs to begin and USD/CAD continued to pullback until 1.4300 came into play, at which point buyers came into show support.
The next week-and-a-half was largely higher-lows, as buyers continued to build in the expectation for tariffs to begin on February 1st, and then on Thursday (January 30th), when President Trump indicated that tariffs were, in fact, coming online on Saturday, USD/CAD tested another breakout to a fresh four-year-high.
That breakout pared back later on Thursday and price continued to hover around 1.4500. But then a report hit on Friday indicating that Trump’s administration would again delay tariffs on Canada, and a larger pullback showed with the pair pushing below the 1.4400 handle.
It was a couple hours after that when the White House walked back that report, saying that the Reuters report of delaying until March 1st was incorrect.
USD/CAD then jumped again to test above the 1.4500 level. This is some chaotic volatility late in the session on Friday, and I’ve added a box around the gyration that began on Thursday to illustrate just how erratic those moves have been. But – perhaps more importantly – given the generally low levels of liquidity that will show on a Sunday open combined with the fact that this very fluid situation will likely remain in the headlines, this could make for a very volatile open in the USD/CAD pair.
USD/CAD Hourly Price Chart
Chart prepared by James Stanley, USD/CAD on Tradingview
Canadian Tariffs: What’s Known, What Isn’t?
Perhaps the lack of details is what drove the Friday report that tariffs would be delayed, but at this point, there’s a lot left to be announced. What we do know is that the White House stated that 25% tariffs will be levied on imports from Canada and Mexico, and 10% tariffs on goods from China. White House press secretary Karoline Leavitt said that more details would be available on Saturday, while also making the statement, ‘these are promises made and promises kept by the president,’ which seems to indicate that the White House will not be backing down.
There’s also the question as to whether there will be a carve out for energy imports to the United States, as tariffs on oil could provide more push on inflation given the U.S. dependency on crude oil for transporting products across the continental 48 states.
And then there’s the question of retaliation, as Trudeau warned that Canada would respond to tariffs. To this point, threats from Canadian politicians ranging from Trudeau to candidate and former BoE Governor Mark Carney to the premier of Ontario, Doug Ford, have generally been met with more Canadian Dollar weakness, highlighting the fact that a larger trade war between the two countries could equation to even higher prices in USD/CAD.
There's also been the pledge of 'pandemic-level support' for workers in Canada should the U.S. impose tariffs. This would likely spell even more Canadian Dollar weakness as debt would probably be required to accomplish that initiative. And this could further drive USD/CAD topside breakouts.
And, on a bigger picture basis, that CAD-weakness could be even more troublesome for the Canadian economy as it pushes-higher on inflation, even as the Bank of Canada has been cutting rates as they did again last week.
So, this is a tenuous situation and President Trump certainly seems to think he’s holding the Trump card, pun intended, which has allowed for him to push the tariff topic closer and closer to reality.
From a strategy perspective, this can make for a dangerous backdrop for chasing breakouts, as there’s been several false breakouts that have appeared. However, for those exercising patience and waiting for support with a higher-low to show, there could be more attraction, such as we’ve seen since the initial breakout on the tariff topic, which then led to a pullback and support at the 1.4000 handle.
USD/CAD Daily Chart
Chart prepared by James Stanley, USD/CAD on Tradingview
USD/CAD Bigger Picture
While the trend on the daily has been clear and running higher, longer-term there’s still the possibility of mean reversion, and price is getting closer and closer to a key juncture on the chart.
In 2020, the swing high came in at 1.4668, just 22 pips inside of the 2015 high of 1.4690. As I’ve been writing about for the past few months, that area marks the top-end of the range that’s held in USD/CAD and until bulls force a decisive move beyond that price, the possibility of mean-reversion remains.
From the monthly chart below bulls have remained in firm control ever since support at 1.3500 in September, and the January candle is shaping up to be bullish, as well. But the big question here on a longer-term basis if whether we see some form of pivot this month and given the hot button nature of the tariff topic, something like that would certainly seem possible. But, likely, we would need to see politicians on both sides of the matter move towards some element of resolution which, at this point, seems a distant prospect.
Until then, the next major resistance sitting overhead is clear at the 1.4690, above which the pair would push up to fresh 20-plus year highs.
USD/CAD Monthly Price Chart
Chart prepared by James Stanley, USD/CAD on Tradingview
--- written by James Stanley, Senior Strategist
Related tags:



Open an account in minutes
Experience award-winning platforms with fast and secure execution.
Economic calendar
Web Trader platform
Our sophisticated web-based platform is packed with features.
Related articles

S&P 500, Nasdaq 100 Claw Back But NVDA Cloud Looms Overhead
Last week was green for both the Nasdaq and S&P 500 but given the sell-off that led into that bounce there’s still a very real question as to whether bears still have a statement to make. And the NVDA situation presents a very real threat.

US Dollar Price Action Setups: EUR/USD, USD/JPY
The US Dollar broke out to a fresh yearly high after the CPI report, and that Dollar strength was on full view in pretty much all major pairings with a particular push in EUR/USD.

USD/JPY Tests 160.00 – Breakout or Fake Out?
USD/JPY has tested above the 160 level for the first time in two months. And near immediately, price retreated 100 pips before buyers loaded in and backed up the bid.
The information on this web site is not targeted at the general public of any particular country. It is not intended for distribution to residents in any country where such distribution or use would contravene any local law or regulatory requirement. The information and opinions in this report are for general information use only and are not intended as an offer or solicitation with respect to the purchase or sale of any currency or CFD contract. All opinions and information contained in this report are subject to change without notice. This report has been prepared without regard to the specific investment objectives, financial situation and needs of any particular recipient. Any references to historical price movements or levels is informational based on our analysis and we do not represent or warranty that any such movements or levels are likely to reoccur in the future. While the information contained herein was obtained from sources believed to be reliable, author does not guarantee its accuracy or completeness, nor does author assume any liability for any direct, indirect or consequential loss that may result from the reliance by any person upon any such information or opinions.
Futures, Options on Futures, Foreign Exchange and other leveraged products involves significant risk of loss and is not suitable for all investors. Losses can exceed your deposits. Increasing leverage increases risk. Spot Gold and Silver contracts are not subject to regulation under the U.S. Commodity Exchange Act. Contracts for Difference (CFDs) are not available for US residents. Before deciding to trade forex, commodity futures, or digital assets, you should carefully consider your financial objectives, level of experience and risk appetite. Any opinions, news, research, analyses, prices or other information contained herein is intended as general information about the subject matter covered and is provided with the understanding that we do not provide any investment, legal, or tax advice. You should consult with appropriate counsel or other advisors on all investment, legal, or tax matters. References to FOREX.com or GAIN Capital refer to StoneX Group Inc. and its subsidiaries. Please read Characteristics and Risks of Standardized Options.