


- Canadian data surprises to the upside
- BoC seen pausing after 275bp of cuts
- Fed easing bets rise to four cuts over next year
- Weekly chart signals bearish trend shift
Summary
A noticeable improvement in Canadian economic data has traders questioning the likelihood of further rate cuts from the Bank of Canada (BoC). At the same time, pricing for Fed easing over the next year continues to build, with traders now favouring four 25-point reductions, up from three just a few weeks ago. As we’ve seen with other currencies like the New Zealand dollar recently, when markets sense a central bank has reached a turning point for policy, it can trigger immediate and often powerful moves. We may have seen the start of one last week, with a strong Canadian GDP report helping complete a notable bearish reversal pattern on the weekly timeframe, pointing to the potential for further downside as we enter December.
Canadian Data Perks Up
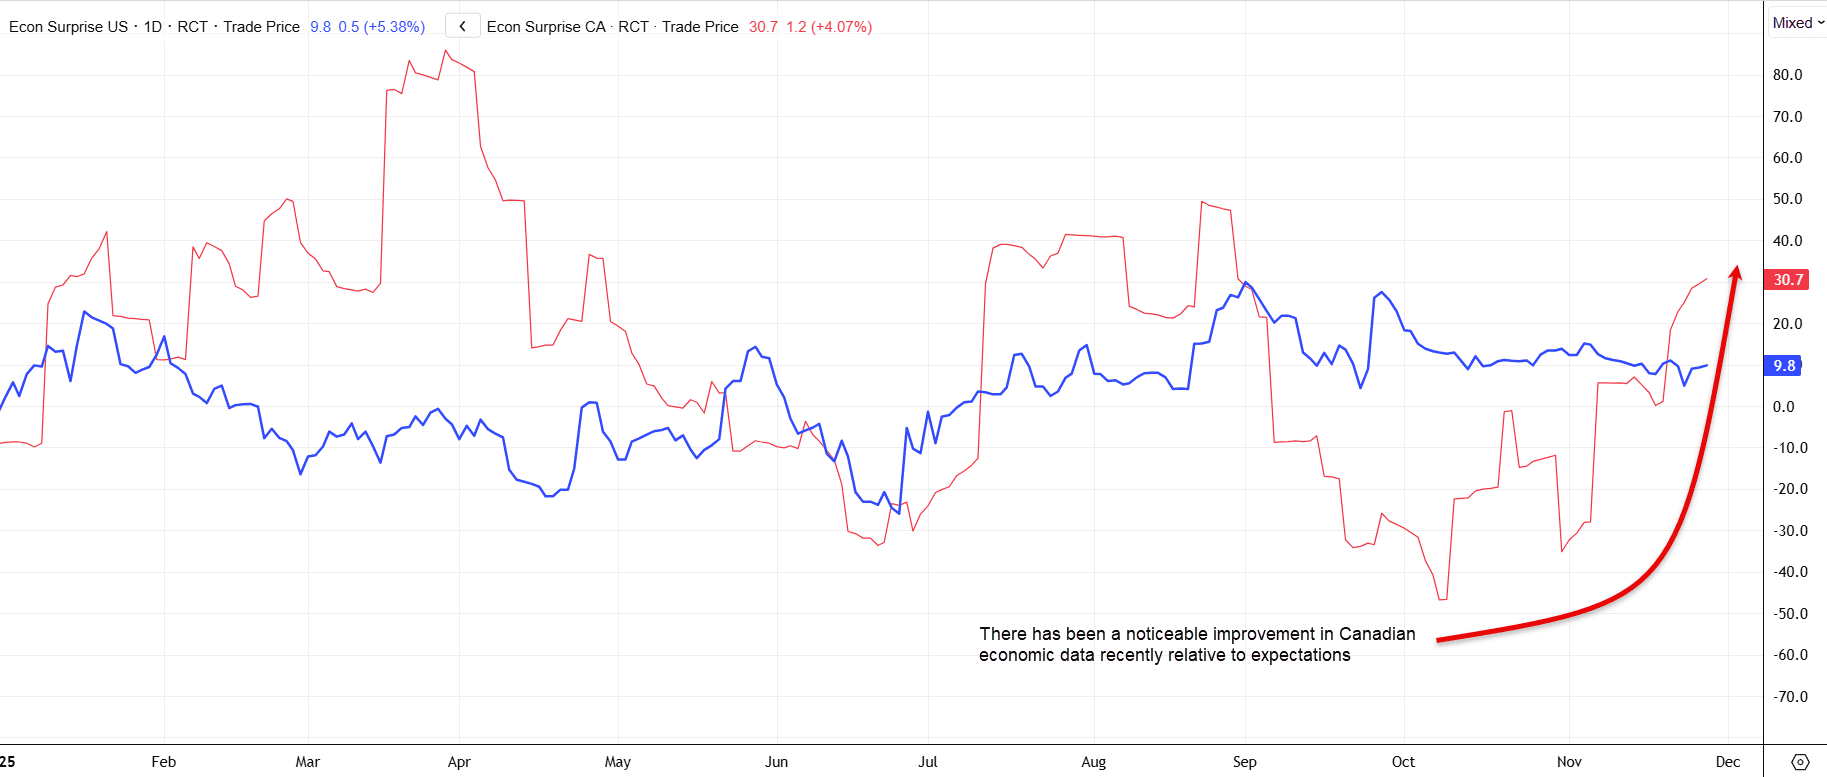
For the first time in quite a while, Canadian economic data is starting to impress relative to expectations, deviating from the trend seen over much of the second half of the year. That can be seen in the graphic below tracking Citi’s economic surprise index for Canada (red line) and the United States (blue line) over 2025. For those unfamiliar, the index measures how economic data prints relative to consensus forecasts, with greater weight on recent releases to help identify trends. Readings above zero suggest more data is beating expectations than missing, with the distance from zero indicating the scale of aggregate beats.
Source: LSEG
In Canada’s case, at 30.7, the beat rate is now the highest level since late August, recovering after a prolonged period of disappointment earlier in the year. While the U.S. also continues to see net beats, the signal is clouded by the timing of the government shutdown, which has limited hard data flow in recent weeks, with what’s been released often severely dated.
BoC Rate Cut Pricing Dwindles
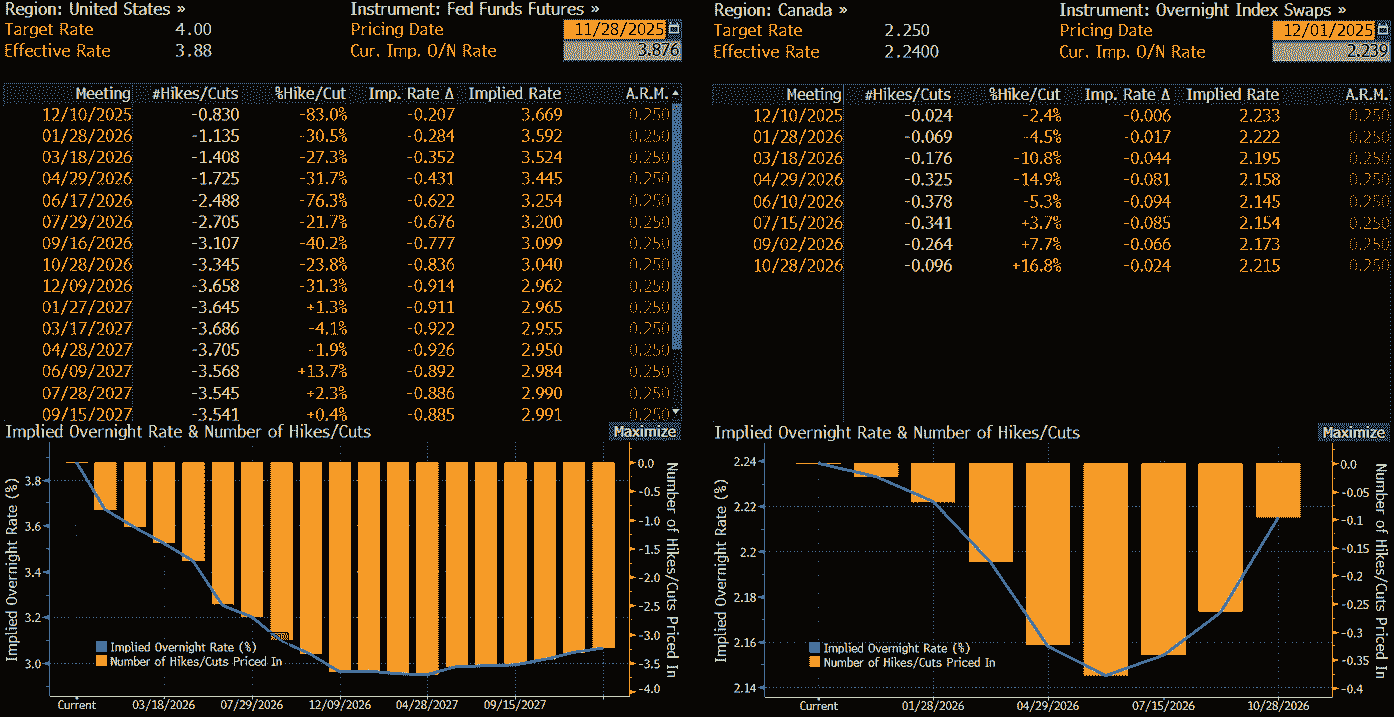
The shifts in data have influenced market pricing for what the Fed and BoC are expected to do with interest rates over the next year. As shown in the graphic on the left, implied pricing from swaps markets favours four 25-point reductions to the Fed funds rate by the end of next year. In contrast, while a residual risk of another cut remains priced in Canada, the collective market expects the BoC has likely concluded its easing cycle with an overnight rate of 2.25%.
Source: Bloomberg
With inflation in Canada well above the BoC’s 2% annual target and activity data starting to pick up, it has sown the seeds for the BoC to potentially call time on the easing cycle when it announces its final monetary policy decision of the year on December 10. When it last met in late October, the bank’s guidance was ultra-cautious, suggesting the Canadian economy faced a “difficult transition” due to trade tensions with the United States.
“If inflation and economic activity evolve broadly in line with the October projection, Governing Council sees the current policy rate at about the right level to keep inflation close to 2% while helping the economy through this period of structural adjustment,” the statement read. “If the outlook changes, we are prepared to respond. Governing Council will be assessing incoming data carefully relative to the Bank’s forecast.”

Labour Market Data Looms Large
In light of recent developments and having already delivered 275 basis points of easing this cycle, the updated guidance may solidify the neutral bias offered previously, signalling the rate-cutting cycle is done. It feels very similar to the setup before the Reserve Bank of New Zealand effectively called time on its easing cycle last week, resulting in a bullish breakout in NZD/USD.
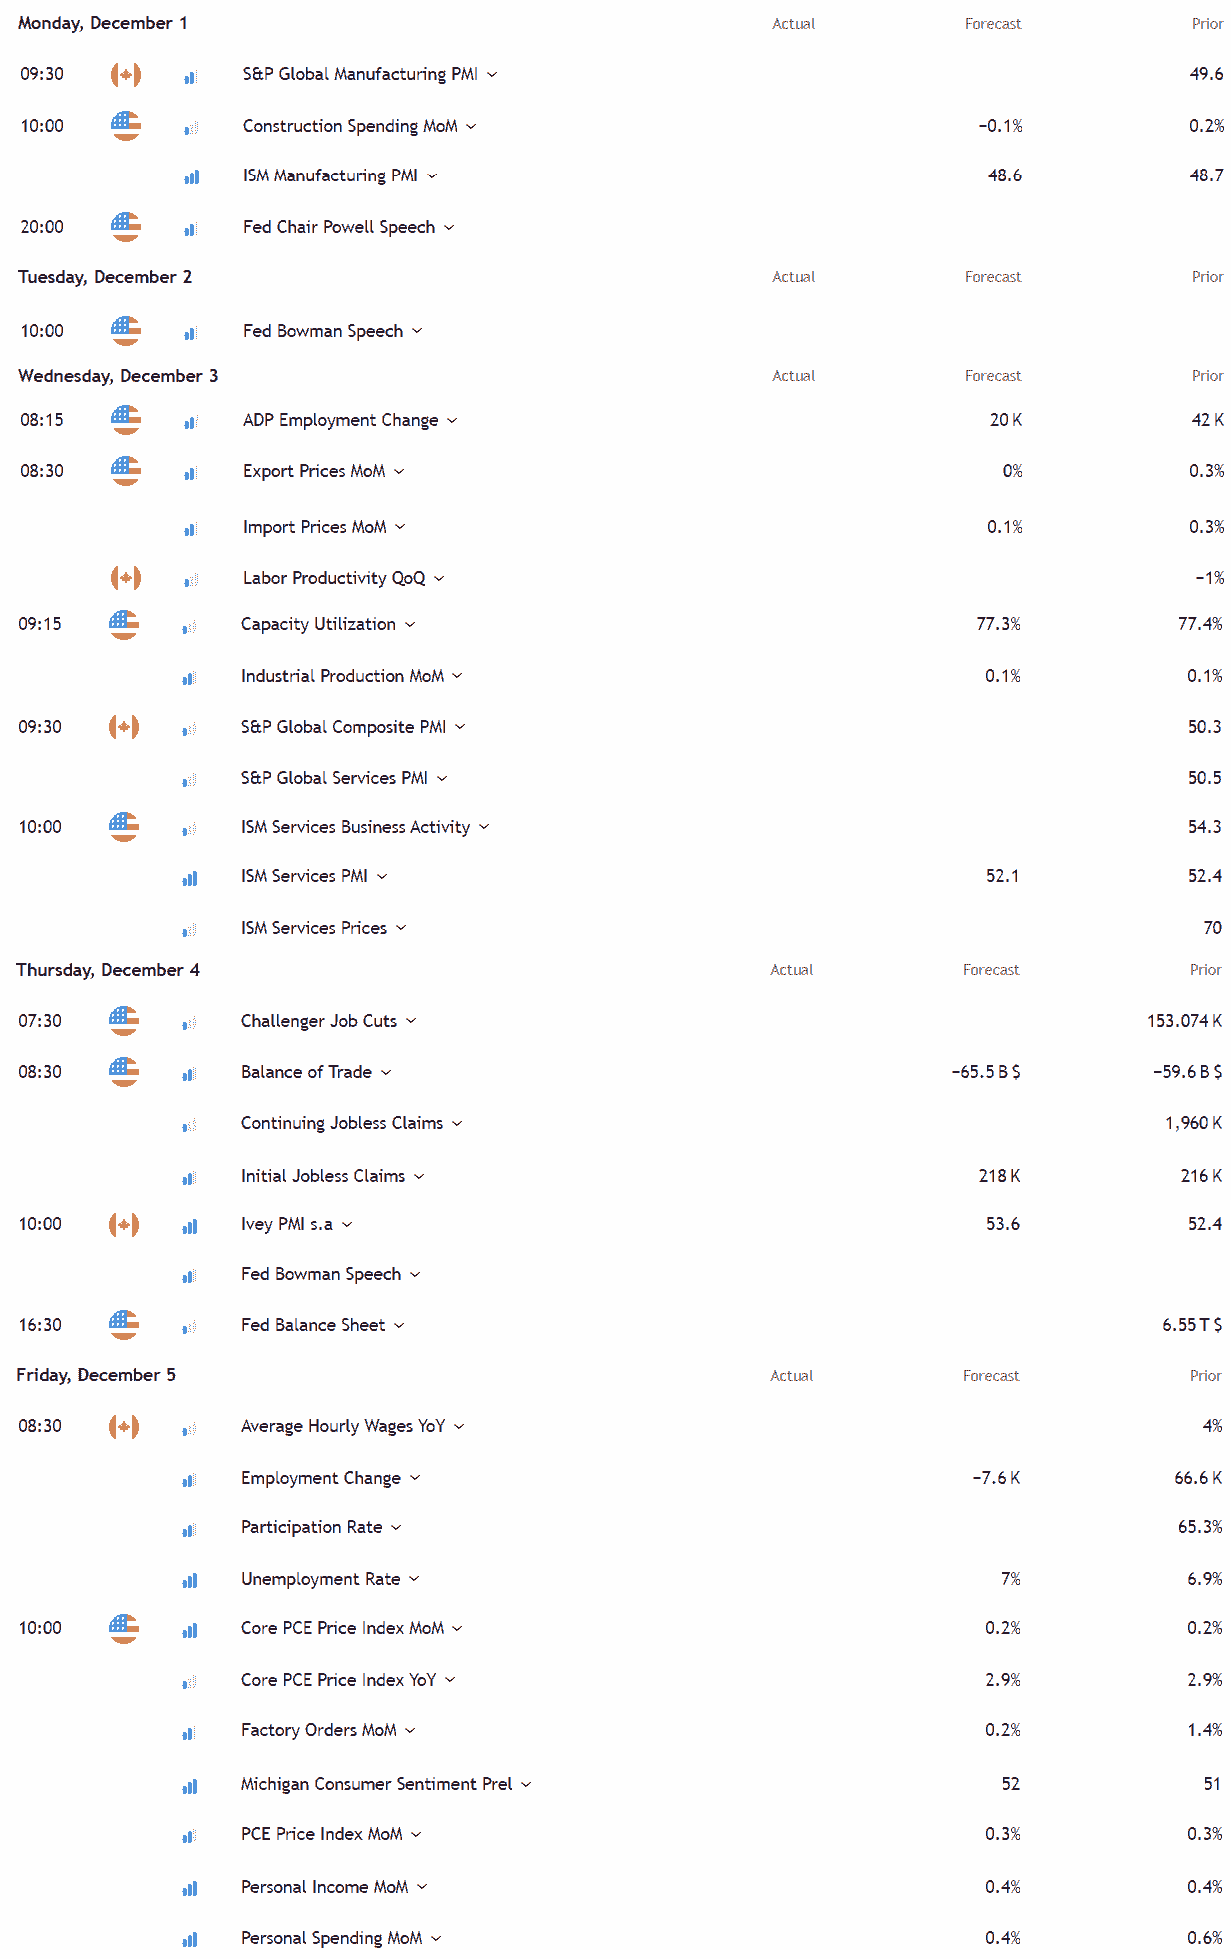
While a similar response from the BoC looks likely, the rate decision is still more than a week away, leaving a window for other data to alter that view. For USD/CAD traders, the key release in Canada arrives Friday with the November jobs report. The data surprised on the upside in October, so another strong showing would only increase conviction that a cyclical upswing may already be underway, given this is a lagging indicator.
Source: TradingView
In the U.S., labour market data remains important, along with the ISM manufacturing and services PMIs. Friday’s core PCE, spending, and income data would normally be top billing, but these figures are for September—an eternity ago. While Jerome Powell and Michelle Bowman from the Fed will be in action, the nature of their appearances during the media blackout before the FOMC December meeting suggests neither will comment directly on the interest rate outlook.
USD/CAD Flashing Bearish Signals
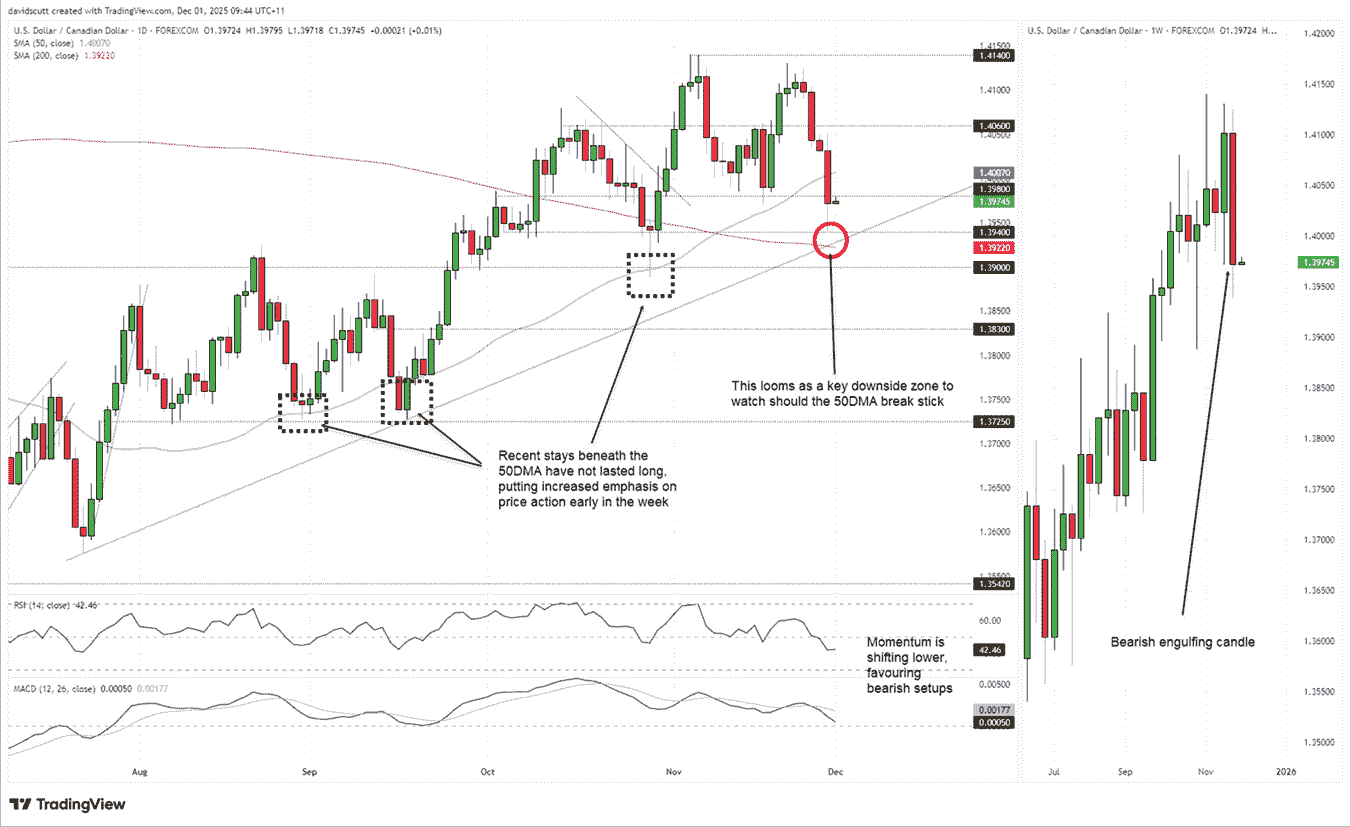
Looking at the USD/CAD chart below, the right-hand pane shows a bearish engulfing candle on the weekly timeframe, a pattern often seen at directional turning points. Arriving after a prolonged bullish move, the signal is arguably strengthened, pointing to the potential for further downside ahead.
Source: TradingView
Zooming in on the daily timeframe on the left, USD/CAD closed the week beneath the 50-day moving average—a notable development considering probes below the level have not tended to last long in recent months. That puts increased emphasis on the price action earlier in the week, especially with the key 200-day moving average located not far below current levels.
1.3940 has often attracted buyers recently, and that was the case again on Friday with the pair bouncing strongly after testing it. It remains a level to watch should we see a continuation of last week’s bearish reversal. A sustained move beyond 1.3940 would bring the July uptrend and 200DMA into play, with a clean break of the latter increasing the likelihood of a meaningful move lower towards 1.3900.
With RSI (14) trending lower beneath 50 and MACD on the cusp of flipping negative after crossing the signal line from above, the message from the oscillators is one of shifting directional risks, with downside pressure starting to build. That favours selling into strength rather than buying dips.
If the pair were to reverse back above the 50DMA and hold there, it would question the bearish signal from price action and momentum indicators, pointing to a period worthy of evaluation rather than flipping outright bullish.






