



While USD-weakness has remained in the equation there’s been a recent tilt of strength in USD/CAD, helped along by a defense of a major psychological level at the 1.3500 handle from last week.
I looked into the pair a couple of weeks ago as that test was happening and as I shared then, there has been a propensity for inflections to show around these types of levels. Last year saw a lot of reaction on both sides of the 1.4000 handle and this comes after the 1.4500 level helped to mark a significant reversal in February.
The 1.3500 level didn’t quite come into play, but that doesn’t mean that it didn’t have impact, as this is what sellers shied away from in June that ultimately led to an ascending triangle – and then a bullish breakout in the pair.
For this year that 1.3500 level finally came into play, albeit briefly, before bringing a strong rally in the pair that ran into the end of last week.
USD/CAD Daily Price Chart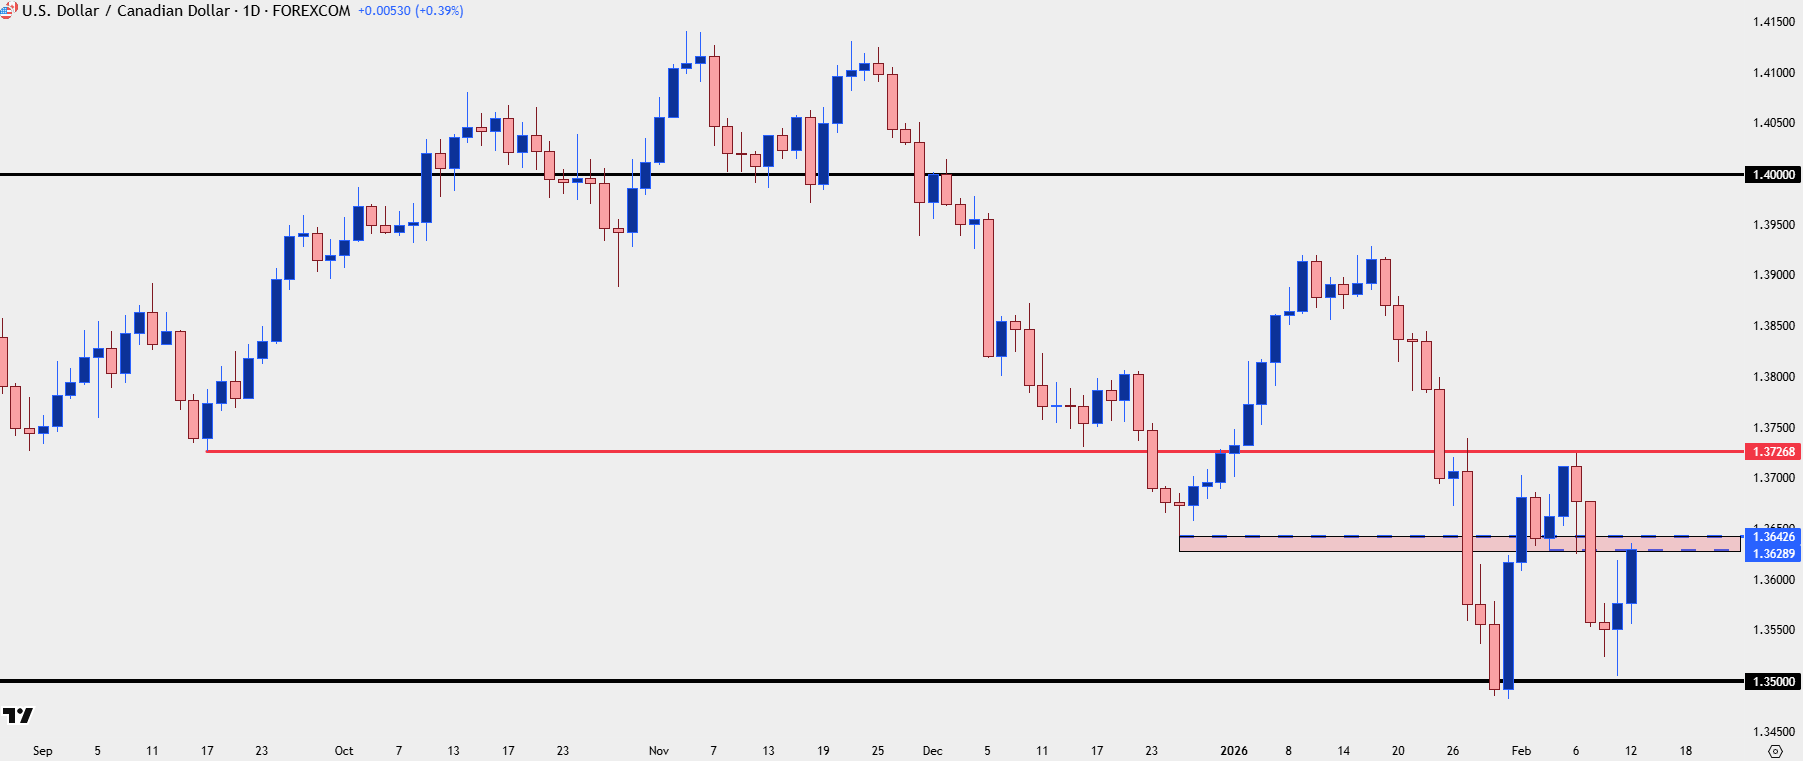
Chart prepared by James Stanley; data derived from Tradingview
USD/CAD Shorter-Term
It was the 1.3727 level that ultimately stalled the move and this is a price that has some prior relevance, as this helped to set a significant swing low back in August and September of last year. Sellers used that resistance last week to run another push towards the lows, but notably, this week’s occurrence stopped just shy of the 1.3500 level, illustrating a degree of bullish anticipation.
That has been followed by a bounce up for a resistance test at prior support in a zone ranging from 1.3629-1.3646, and this begins to set up the pair as one of the more attractive venues for scenarios of USD-strength ahead of tomorrow’s CPI report.
USD/CAD Four-Hour Price Chart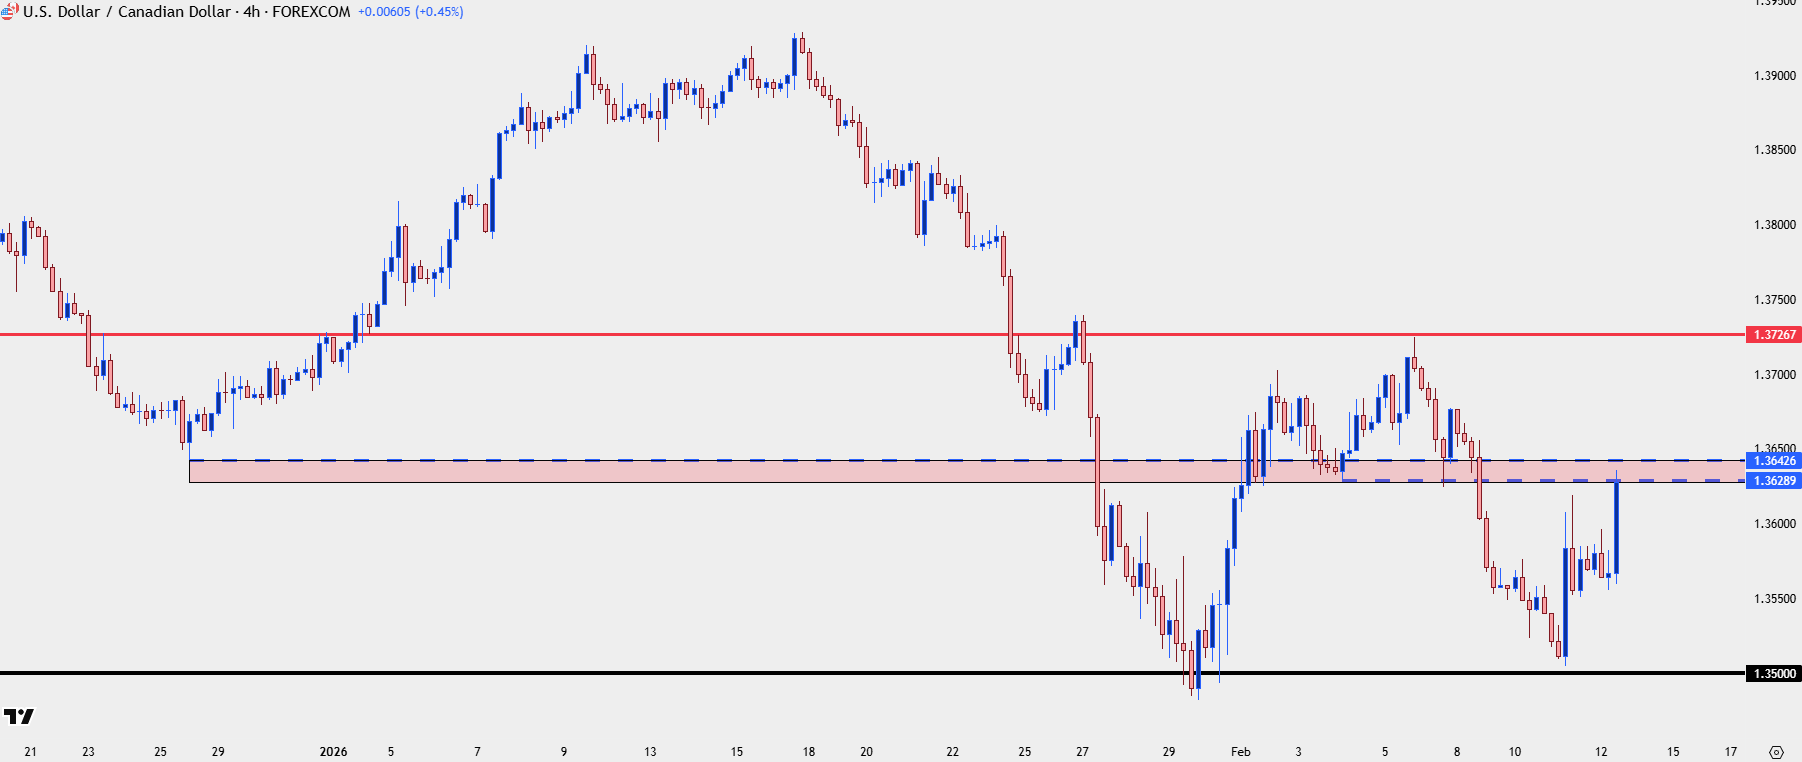
Chart prepared by James Stanley; data derived from Tradingview
USD/CAD Big Picture
While we wind towards the end of the week there still remains an open door for volatility, especially in the USD and related pairs as the CPI report carries intense importance given the focus on rate expectations around the Fed. But from the weekly chart we can see an extended underside wick following that test of 1.3500, and while the higher-low is slight from this basis, the importance of that reaction stands out.
If we do get a bullish reaction that closes the weekly candle as green (or blue in my chart’s case) then we could also make the argument for a hammer formation to go along with that higher-low, which would further illustrate bullish potential for the pair as we move into the middle of Q1.
Sitting overhead it’s the 1.3925 level that stands out as important, as that helped to build an evening star formation on the weekly that ultimately led to the 1.3500 test.
USD/CAD Weekly Price Chart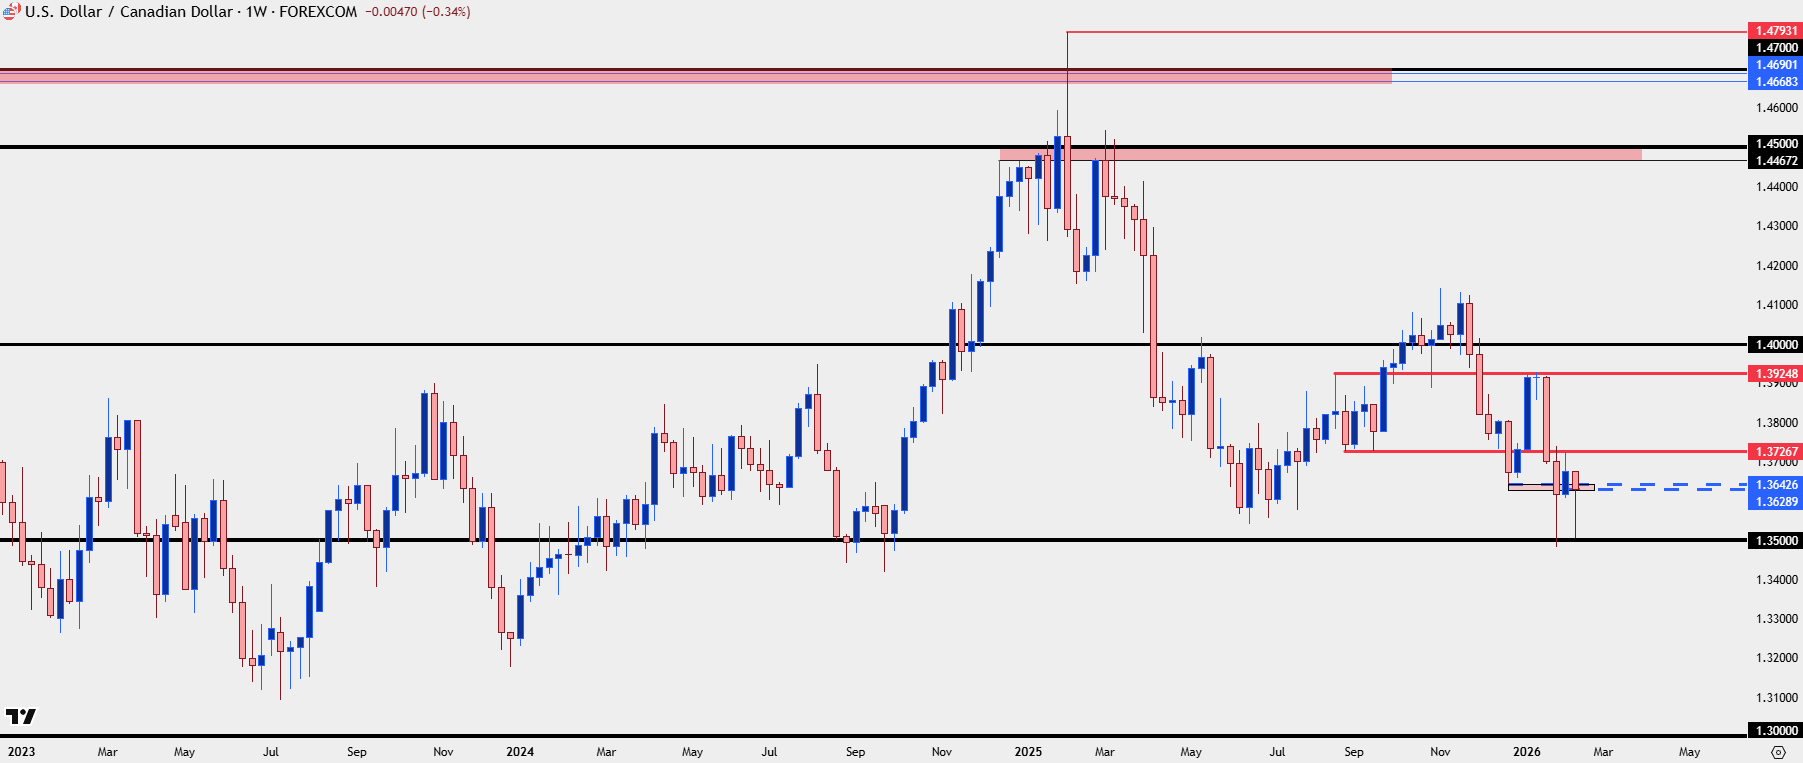
Chart prepared by James Stanley; data derived from Tradingview
--- written by James Stanley, Senior Market Analyst, Global Macro






