We are now halfway through October, and one of the clearest themes across the cryptocurrency market has been the lack of meaningful price action. The absence of direction has become increasingly evident in short-term trading, and even Bitcoin, the market’s benchmark asset, has failed to generate the type of moves needed to restore confidence across the sector. Most major cryptocurrencies recorded weekly fluctuations of around 3.5%, reflecting a phase of caution and indecision that continues to gain relevance.
For now, the lack of significant price movements is beginning to highlight a broader decline in market activity. As long as prices continue to oscillate within key technical levels without breaking important barriers, this phase of neutrality could continue to consolidate and remain a dominant characteristic of the market in the sessions ahead.

Performance of Major Cryptocurrencies
Source: Data - StoneX, Tradingview
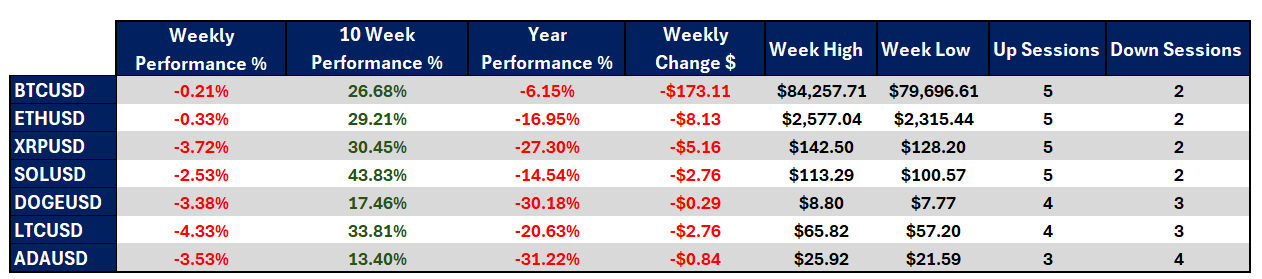
- The week has not been particularly favorable for the cryptocurrency market. Broadly speaking, weakness remains a dominant theme, with even Bitcoin, the market's reference asset, struggling to sustain meaningful bullish momentum. Litecoin stands out with a decline of more than 4.3% over the week, while Bitcoin and Ether have shown the greatest relative stability, posting losses close to 0.3%. Although these moves do not represent significant declines, they also fail to signal a meaningful recovery in confidence. The common theme remains the lack of momentum across the market, a situation that continues to support a cautious and neutral environment in the short term.
- Looking at the last 10 weeks, the picture remains more constructive. Most cryptocurrencies continue to trade above the levels seen ten weeks ago, suggesting that medium-term stability remains relatively intact. In this context, Solana stands out with gains of more than 43%, while Cardano maintains advances close to 13%, although it has begun to show a more visible slowdown compared to previous weeks. The key takeaway is that, while gains remain positive over the medium term, they continue to shrink gradually, reflecting fading bullish momentum and supporting a broader consolidation phase across the market.
- The annual outlook remains one of the sector's main challenges. Major cryptocurrencies continue to trade below the levels observed at the beginning of 2026, reflecting that the weakness recorded during the first months of the year still weighs on long-term performance. Cardano remains one of the weakest assets, posting losses of around -31.22%, while Bitcoin is down approximately -6.15%. This suggests that BTC remains one of the closest major cryptocurrencies to recovering a positive yearly performance, while much of the market continues to operate under negative annual returns.
- Bitcoin, as the leading cryptocurrency, has also struggled to restore strong investor confidence during the week. The price has moved by barely $170 compared with the previous week and even traded below the important $80,000 psychological level during recent sessions. This behavior reflects persistent difficulty in overcoming key resistance levels and reinforces the cautious sentiment that continues to spread across the broader market.
- In general terms, the cryptocurrency market continues to develop under a backdrop of weakness and indecision. The buying momentum that dominated previous weeks has faded and, for now, even Bitcoin has failed to provide enough confidence to support the rest of the sector. As long as this lack of direction remains dominant, caution is likely to continue shaping much of the market's behavior in the coming sessions.
Colors range from red to green. Red indicates negative correlations, while green indicates positive correlations.
Source: Data - StoneX, Tradingview
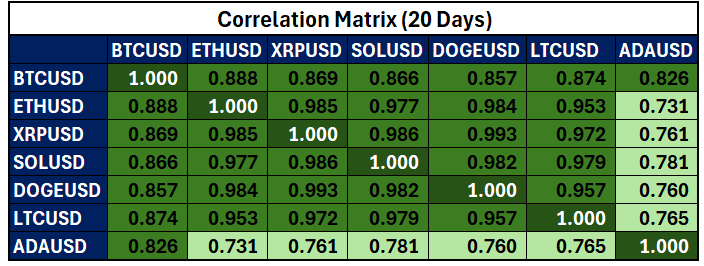
From a correlation perspective, there has also been a noticeable increase in alignment among the major cryptocurrencies. Correlation coefficients have strengthened relative to previous weeks, and many assets now trade with readings above 0.8, suggesting that a large portion of the market is closely following Bitcoin's price action. Correlation coefficients can change over time.
This development is relevant because Bitcoin itself continues to trade in a directionless environment. As the market becomes increasingly aligned with the benchmark cryptocurrency, the lack of momentum in BTC is beginning to extend across the broader sector. This suggests that the caution currently dominating market activity is no longer limited to isolated cases but has become a more generalized characteristic of the cryptocurrency market. Unless Bitcoin begins to generate more decisive moves, this phase of neutrality could remain a relevant feature of price action in the sessions ahead.
Bitcoin Continues to Struggle to Establish a Clear Direction
Source: StoneX, Tradingview
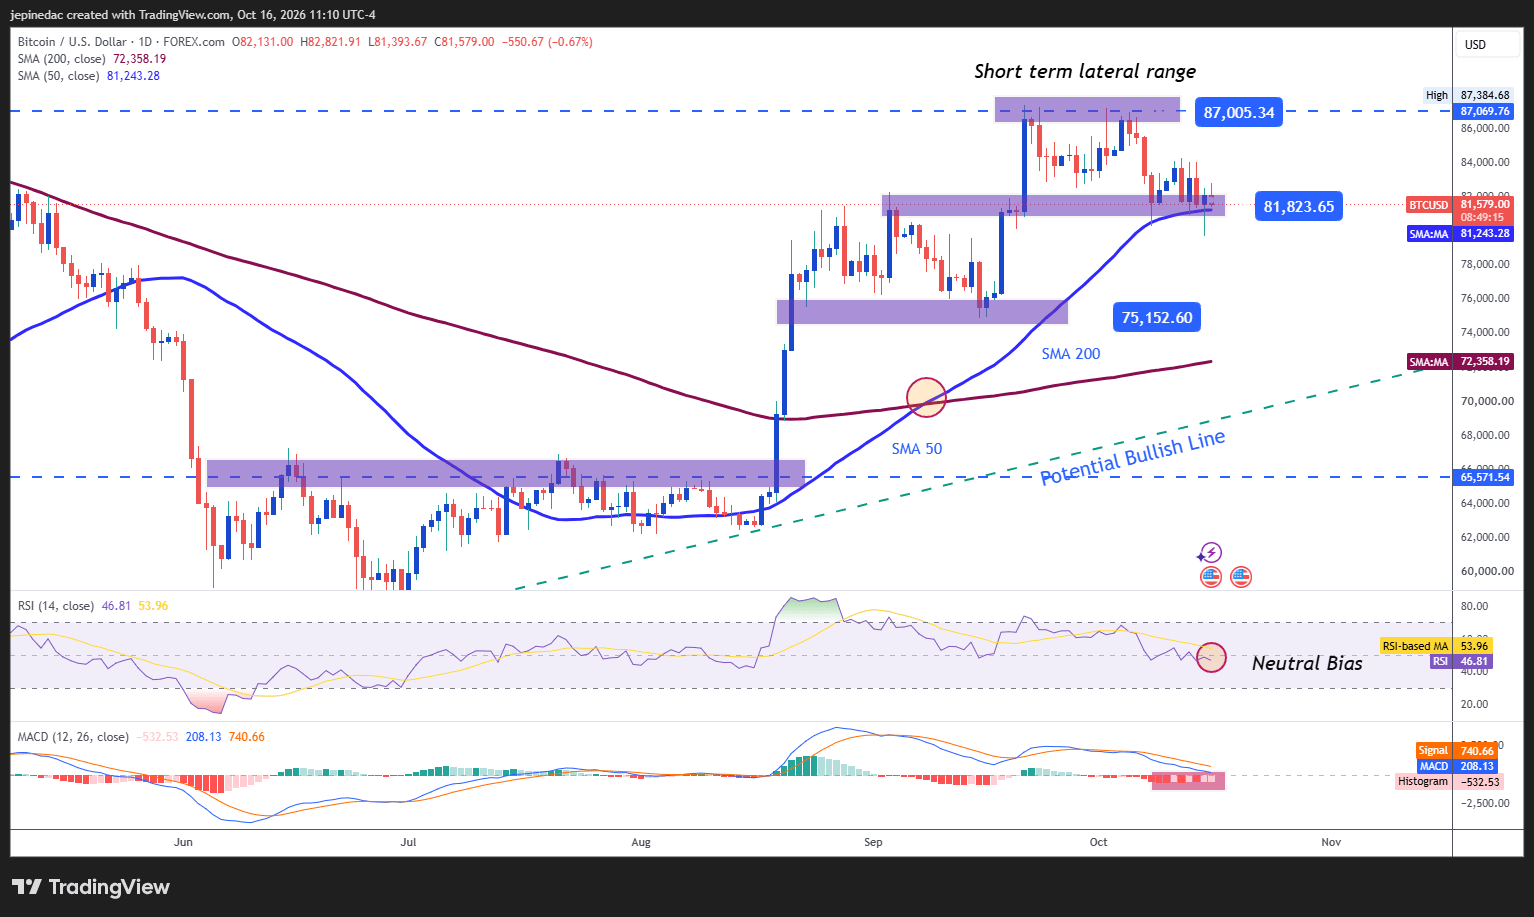
As the market's benchmark asset, Bitcoin continues to show limited price action and remains trapped within key technical boundaries. Although previous weeks hinted at the development of a medium-term bullish structure, recent trading activity increasingly reflects a broader consolidation phase.
The absence of meaningful movements is beginning to favor the formation of a trading range that could emerge as the dominant technical structure during the short term. As long as price fails to overcome important resistance levels, it will remain difficult to argue for either a strong recovery or a clearly defined trend.
Indicators:
- Both the MACD and RSI continue to trade near their respective neutral zones. This reflects a balance between buyers and sellers, while short-term moving averages also remain directionless. As a result, a broader phase of indecision continues to be a relevant scenario for the market.
Key Levels:
- $87,000 – Major Resistance: An area of recent highs that remains the most important upside barrier on the chart. A sustained move above this level could restore relevance to the bullish bias and reinforce the broader bullish structure developed over previous months.
- $81,800 – Near-Term Barrier: An important equilibrium area that coincides with the 50-period simple moving average. If price continues to trade near this level, a lack of direction could persist and support the development of a broader trading range.
- $75,100 – Key Support: A level that aligns with the most important lows observed in recent weeks and remains close to the 50-period simple moving average. A move back toward this area could place the current bullish structure at risk and open the door to more meaningful selling pressure.
Cardano Begins to Put Its Trendline at Risk
Source: StoneX, Tradingview
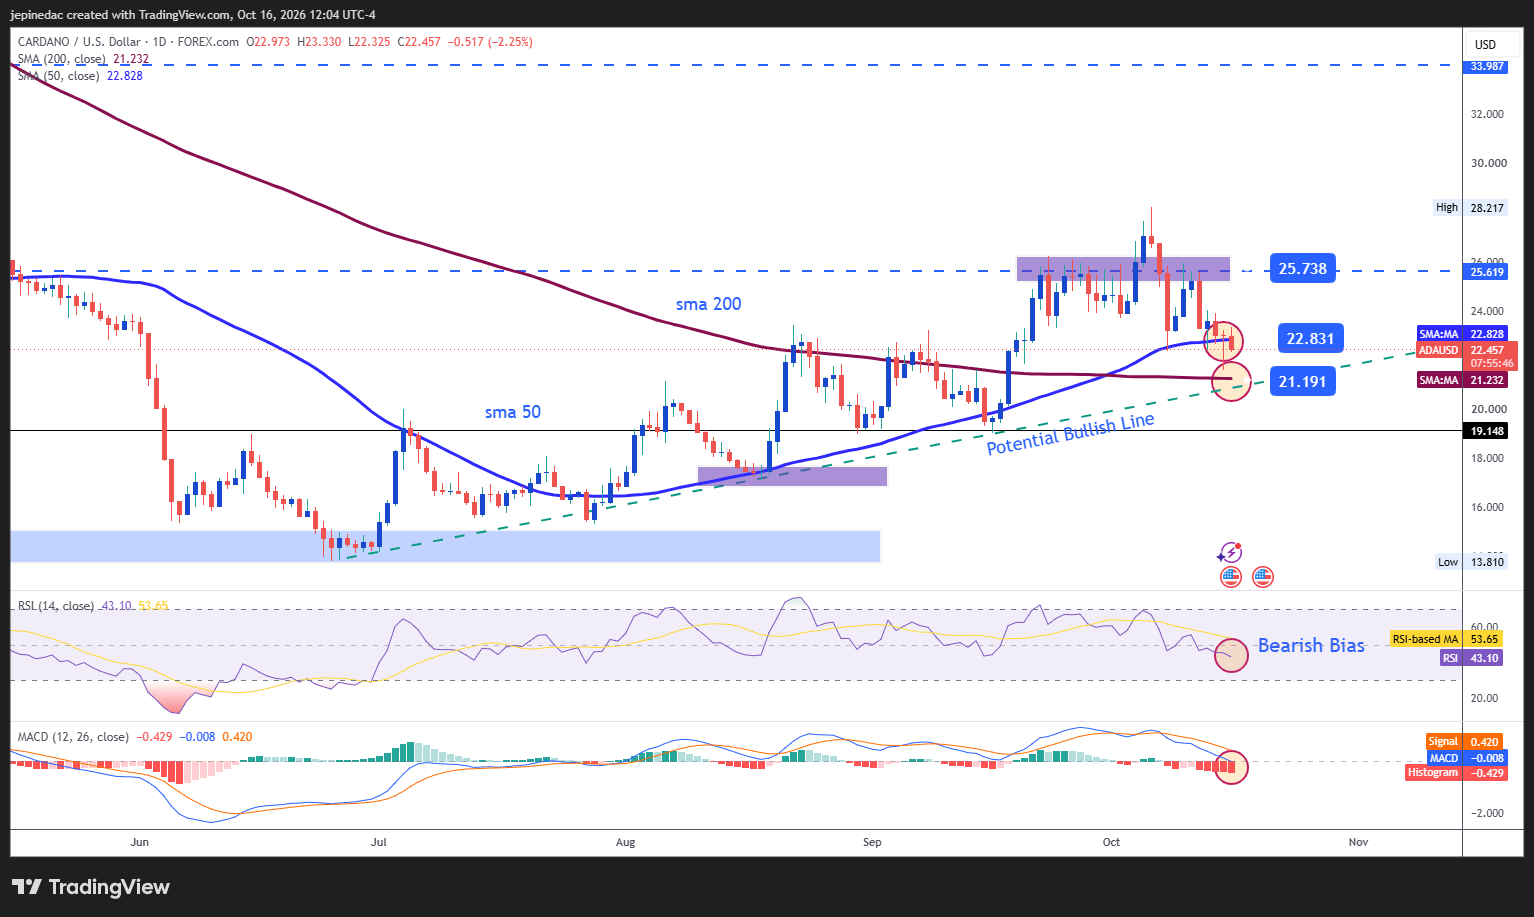
Cardano has been one of the cryptocurrencies showing the greatest degree of weakness over both the medium and long term. Although price continues to respect the bullish trendline that has supported much of the market's activity in recent weeks, selling pressure has become increasingly relevant during the short term.
As a result, Cardano is moving closer to a critical area for its current structure. If bearish momentum continues to build, a break of the existing bullish trendline could start to emerge and open the door to a more dominant bearish bias over the coming weeks.
Indicators:
- Both the RSI and the MACD histogram continue to trade below their respective neutral zones. This suggests that market momentum and short-term moving-average strength continue to favor sellers. As long as this dynamic remains in place, bearish pressure could continue to dominate trading activity.
Key Levels:
- 25.73 – Key Resistance: An area of recent highs that represents the most important upside barrier to monitor in the short term. A sustained move above this level could restore buying momentum and reinforce the current bullish trendline as the dominant structure on the chart.
- 22.83 – Near-Term Barrier: An equilibrium level that coincides with the 50-period simple moving average. Continued trading around this area could reinforce a phase of indecision and support the development of a short-term trading range.
- 21.19 – Main Support: An important support zone that aligns with the 200-period simple moving average and the base of the primary bullish trendline. A move back toward this level could undermine the recovery seen in previous weeks and favor the appearance of stronger selling pressure, potentially leading to the formation of a more relevant bearish structure in the short term.
Written by Julian Pineda, CFA, CMT – Market Analyst
Follow him on: @julianpineda25