
With just one week left before the end of April, one of the most consistent developments in the cryptocurrency market has been the emergence of a new phase of weakness and indecision, which is starting to erode the demand momentum seen in previous weeks. Most major cryptocurrencies have failed to close the week with consistent gains, and the only asset showing a slight positive variation is Bitcoin, which, as the market benchmark, has managed to hold a modestly positive position in the short term.
Overall, the week has ended with notable bearish corrections across the crypto market, and this new phase of neutrality or weakness may continue to play a relevant role in price action in the coming sessions.

Performance of major cryptocurrencies
Source: Data - StoneX, Tradingview
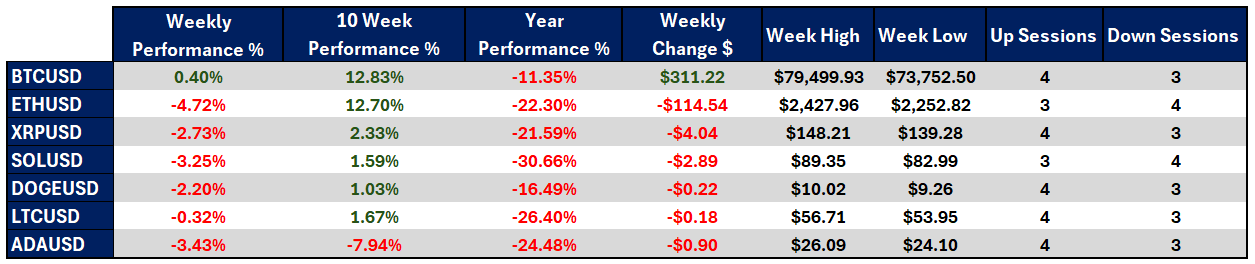
- The only cryptocurrency that has managed to post consistent gains during the week has been Bitcoin, with a modest +0.4% increase, allowing it to maintain relative stability in the short term. On the other hand, Ethereum has been the most affected, with a decline of -4.72%. Despite being the second-largest cryptocurrency by market cap, it has failed to maintain stability and reflects more pronounced weakness in the short term.
- Looking at the past ten weeks, the market still holds positive levels compared to closing prices from that period. In this context, Bitcoin continues to stand out as the most stable asset in the medium term, with a +12.83% gain. In contrast, Cardano remains one of the most affected, showing a -7.94% decline compared to its levels ten weeks ago.
- However, on a year-to-date basis, the market remains in negative territory, indicating that recent recoveries have not been enough to fully offset earlier losses. This continues to highlight a dominant bearish bias in the long term. Solana remains one of the hardest-hit assets, down around -30.66%, while Bitcoin shows greater relative stability with a -11.35% variation compared to its yearly open.
- Bitcoin, as the market benchmark, is currently the only cryptocurrency showing relative stability across the short, medium, and long term. During the week, it has also attempted to move back toward the $80,000 level, positioning itself as the most resilient asset in the market. However, this stability has not extended to the broader crypto ecosystem.
- Overall, the market once again reflects broad-based weakness, with most cryptocurrencies closing in negative territory and only Bitcoin managing to hold some stability. This suggests that indecision has once again taken control of short-term price action, and may continue to dominate amid the lack of demand momentum.

Color scale from red to green – Red for negative correlations and green for positive correlations
Source: Data - StoneX, Tradingview
From a correlation standpoint, most major cryptocurrencies continue to show a positive relationship with Bitcoin. However, there are emerging signs of weakening correlation, such as Dogecoin, which now shows a coefficient below 0.8, and especially Cardano, with a coefficient near 0.1. This highlights a growing disconnection from Bitcoin’s price behavior in the short term. Correlation coefficients may change over time.
This shift suggests that, even if Bitcoin maintains stability, it may not be enough to support the rest of the market. Some cryptocurrencies have begun to decouple from its movements, reinforcing the idea of a more fragmented market with a more pronounced indecision dynamic.
Additionally, this behavior may indicate that capital flows and confidence peaks are increasingly concentrated in Bitcoin, leaving the rest of the market with less capacity to react. This could sustain a bias of weakness and indecision across cryptocurrencies in the coming sessions.
Bitcoin attempts to sustain recovery
Source: StoneX, Tradingview
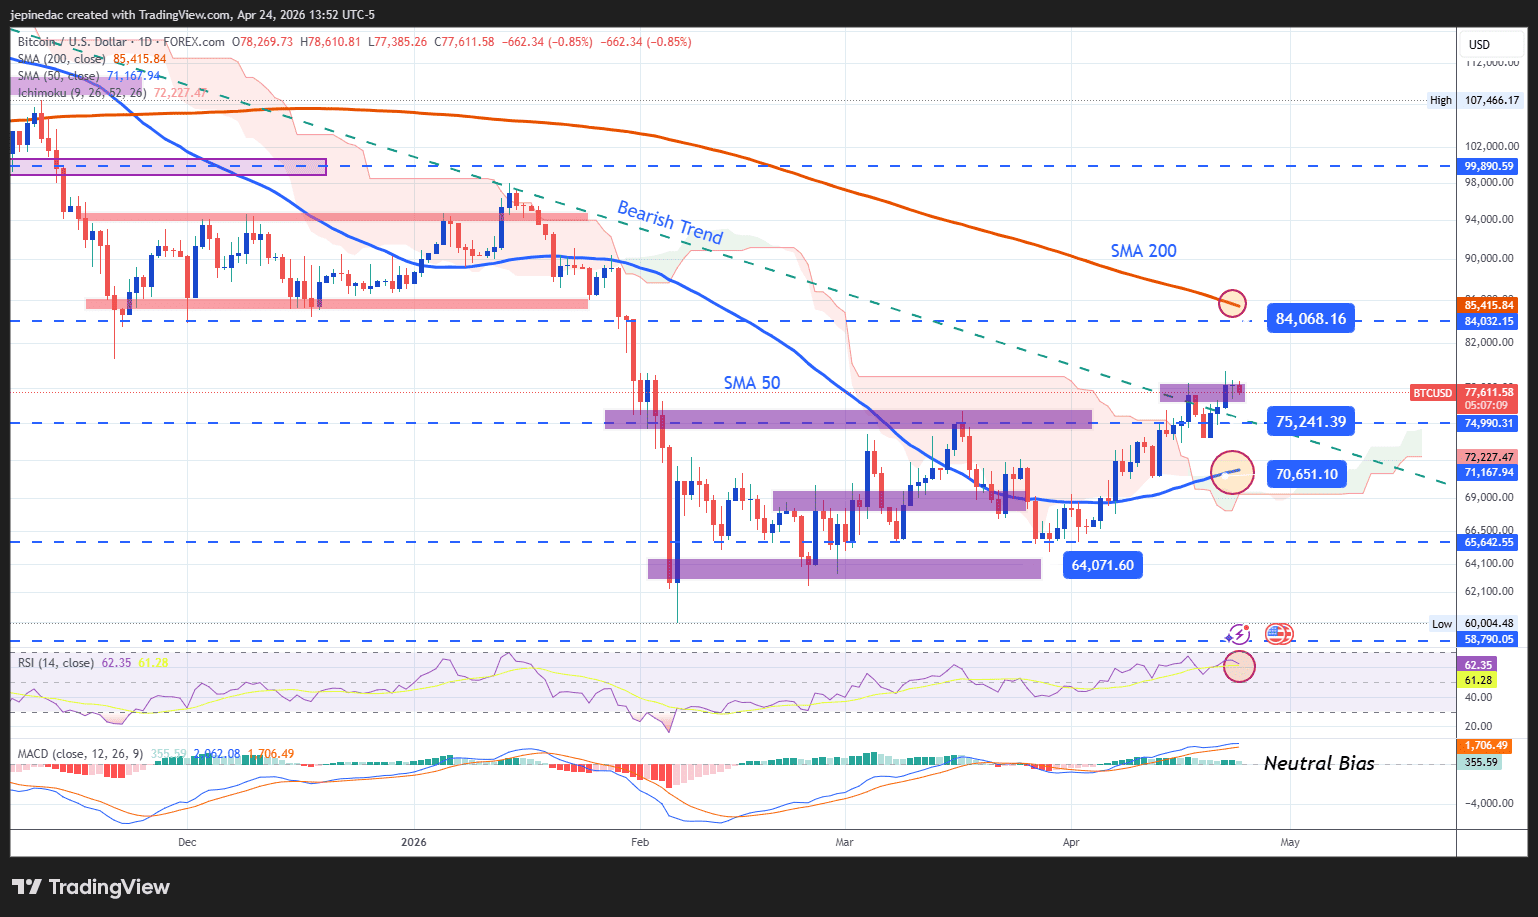
Recent price action in Bitcoin has helped maintain a degree of short-term stability. At the moment, the asset is attempting to approach a break of a long-term bearish trendline that has been in place for several months.
If buying pressure manages to hold in the coming sessions, this could open the door for a break of that bearish structure, paving the way for a more relevant bullish bias in the market.
Indicators:
- At present, the MACD indicator is showing readings close to the zero level, reflecting a balance in moving average strength and, therefore, a phase of indecision. However, the RSI remains slightly above the 50 level, suggesting that bullish momentum has not fully disappeared and that buying pressure still has some presence in the market.
Key levels:
- 84,000 USD – Key resistance: A zone of relevant highs from previous weeks, close to the 200-period moving average. A break above this level could confirm a more structured bullish bias in the medium term and signal the end of the long-standing bearish trendline.
- 75,000 USD – Near-term barrier: A level that previously acted as key resistance and now serves as an important reference in the event of short-term corrections.
- 70,000 USD – Key support: A zone aligned with the 50-period moving average. Moves toward this level could weaken the recent bullish bias and reinforce a phase of short-term indecision.
Ripple remains stuck in a consistent range
Source: StoneX, Tradingview
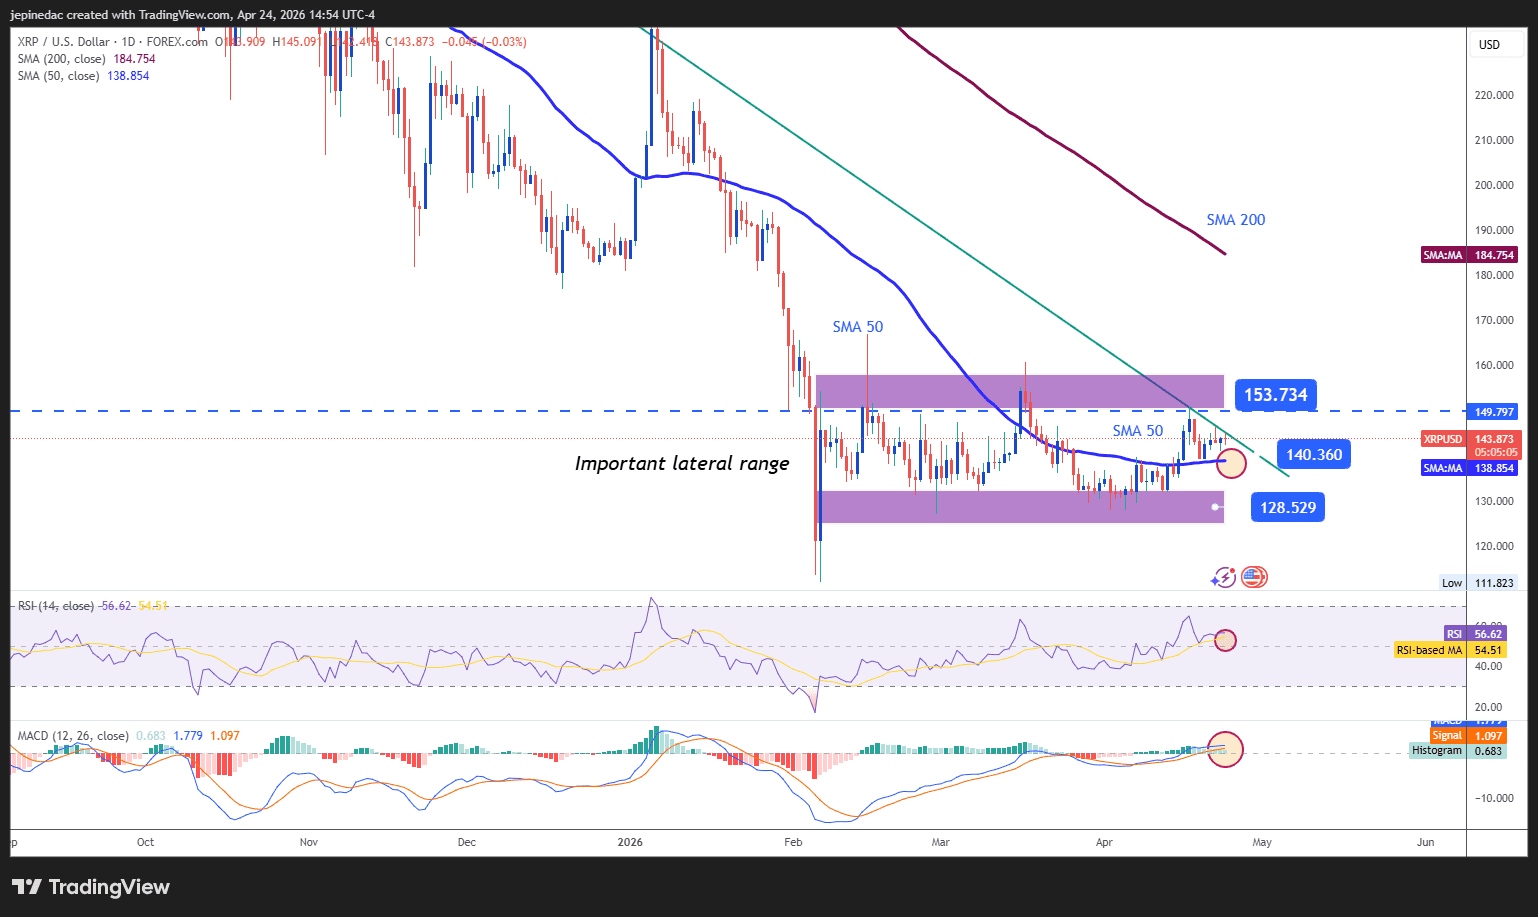
Ripple has been one of the cryptocurrencies that best reflects the market’s neutral tone in the short term. Recent price movements have not been enough to break the range that has been forming, suggesting that this sideways phase may continue in the coming sessions.
Indicators:
- Both the RSI and MACD remain close to their neutral levels, indicating a balance in market forces. This reinforces the idea that, rather than a clear trend, the market is currently in a phase of indecision.
Key levels:
- 153.734 – Key resistance: The upper boundary of the current range, acting as the most relevant level for bullish strength. A move above this level could trigger a meaningful structural shift and support a more dominant bullish bias in the coming sessions.
- 140.36 – Near-term barrier: The mid-range level, close to the 50-period moving average. Price action in this area could continue to reinforce the sideways structure.
- 128.52 – Key support: A level aligned with recent lows. A move toward this zone could bring back the underlying bearish trend that has been in place for several months and reinforce selling dominance in the coming weeks.
Written by Julian Pineda, CFA, CMT – Market Analyst
Follow him on: @julianpineda25