
The first week of May begins and, for now, a stronger confidence environment has started to stand out in the price action of major cryptocurrencies. Several assets have managed to reach new highs as demand stabilizes in the short term, reflecting the emergence of a more consistent bullish bias across the crypto market.
Bitcoin, as the market’s reference asset, remains near the $80,000 level, which stands as the main barrier to watch, and has begun attempting to form a new short-term uptrend. This suggests that confidence has started to return to the market, and if this bullish bias holds, it could remain relevant in the coming sessions.

Performance of major cryptocurrencies
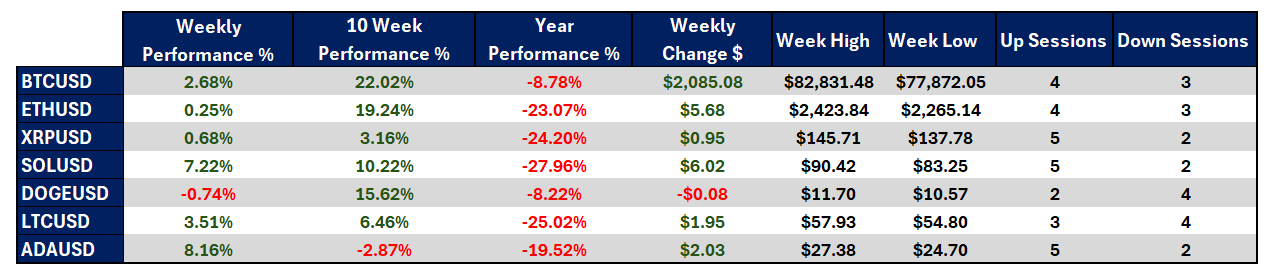
Source: Data - StoneX, Tradingview
- Solana, which had been one of the most affected cryptocurrencies in previous weeks, managed to close the week with the strongest positive performance, posting a gain of 7.22%. On the other hand, Dogecoin was the only cryptocurrency that failed to close in positive territory, showing a decline of -0.74%, making it the weakest performer in the short term. Overall, most of the market posted positive results, reflecting a clear bullish bias.
- Looking at the past ten weeks, the market shows a recovery in medium-term confidence, with most cryptocurrencies trading above the levels seen during that period. Bitcoin stands out, posting a gain of around 22% and positioning itself as the most robust asset in this timeframe. In contrast, Cardano shows a decline of -2.87%, reflecting a lack of consistent recovery.
- Year-to-date, the market still faces a key challenge, as none of the major cryptocurrencies have managed to trade above their 2026 opening levels. Solana remains the most affected, with a decline of -25.02%, while Dogecoin, despite recent weakness, shows a more moderate drop of -8.22%, indicating relative stability over the longer term.
- Bitcoin, as the market benchmark, is beginning to show more consistent strength, with price action moving above the 80k level, reinforcing the relevance of the bullish bias in recent sessions.
- Overall, most of the market has managed to sustain positive performance throughout the week, supported by a renewed confidence environment. As new highs continue to be reached, it is likely that buying pressure could continue to consolidate in the short term.
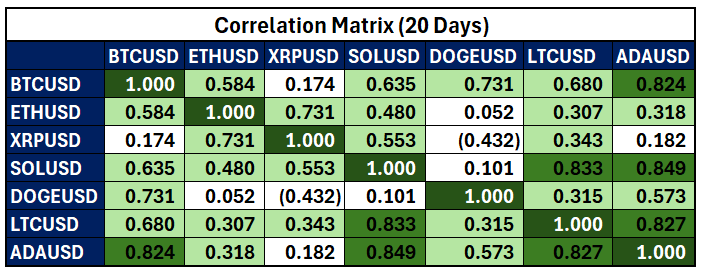
Color scale from red to green – Red for negative correlations and green for positive correlations
Source: Data - StoneX, Tradingview
From a correlation standpoint, a loss of synchronization between major cryptocurrencies and Bitcoin continues to stand out. In most cases, correlation coefficients remain below 0.7, indicating that while a positive relationship exists, it is not strong enough to reflect a fully aligned market.
Assets such as XRP even show correlation levels close to 0.1, highlighting a lack of short-term alignment. It is important to note that correlation coefficients can change over time.
This suggests that, despite the recent rebound, the market is still not fully aligned, meaning the recovery has not been uniform. It is possible that the strength seen in Bitcoin may take time to spread across the broader market, indicating that challenges remain in achieving a more widespread recovery in demand.
In this context, although some assets have shown improvement, a more consistent alignment across the market is still needed for this strength to become sustainable. This would require Bitcoin not only to maintain its strength but also to transmit that momentum to the rest of the market.
Bitcoin attempts to form a new trendline
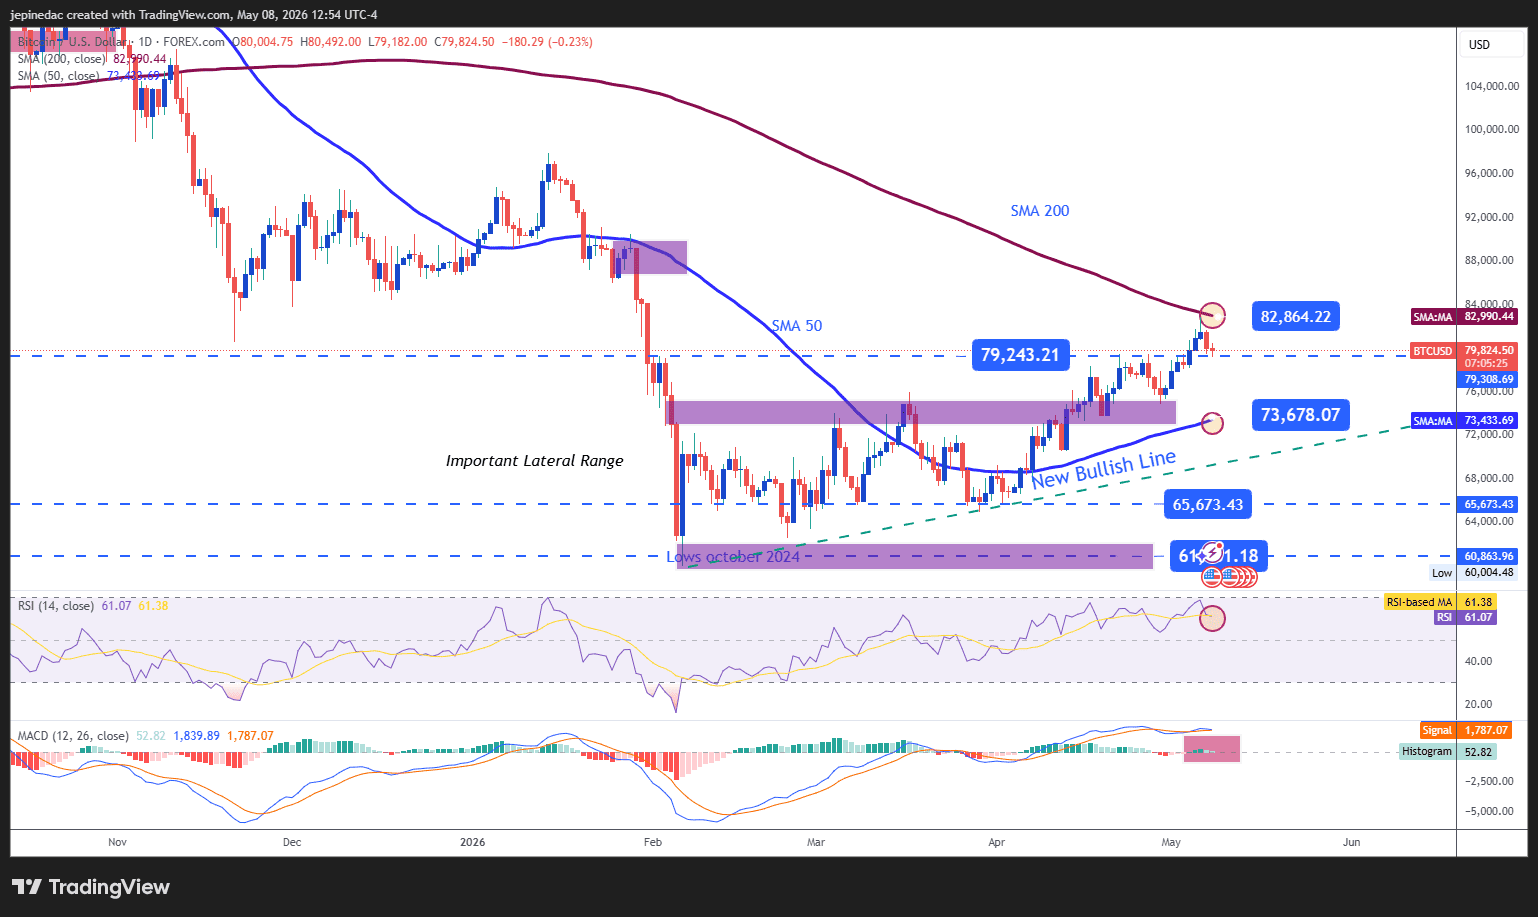
Source: StoneX, Tradingview
Recent price action in Bitcoin has begun to show a pattern of higher highs, supporting the potential formation of a new short-term bullish trendline. As long as buying pressure remains stable, this structure could become the most relevant technical factor in the coming sessions.
This development follows a breakout from the previous sideways channel that had dominated price action in recent weeks, reinforcing the idea of a shift in market dynamics.
Indicators:
- At present, RSI remains above the 50 level, indicating that short-term bullish momentum is still relevant and supporting the formation of a bullish bias. However, the MACD shows a more neutral picture, as the histogram remains close to the zero level, suggesting that indecision may still be present as this bullish momentum attempts to consolidate.
Key levels:
- 82,800 USD – Key resistance: A major high zone aligned with the 200-period moving average. A move above this level could confirm a clearer structural shift and reinforce a dominant bullish bias, extending the current trendline.
- 73,600 USD – Near-term barrier: A key neutral level that previously acted as the upper boundary of the sideways channel and aligns with the 50-period moving average. This level could serve as a reference point in case of short-term pullbacks.
- 65,670 USD – Key support: A zone of relevant lows acting as the main downside barrier. A move toward this level could weaken the current structure, reintroduce a neutral phase, and invalidate the emerging bullish trendline.
Ripple fails to keep pace and remains range-bound
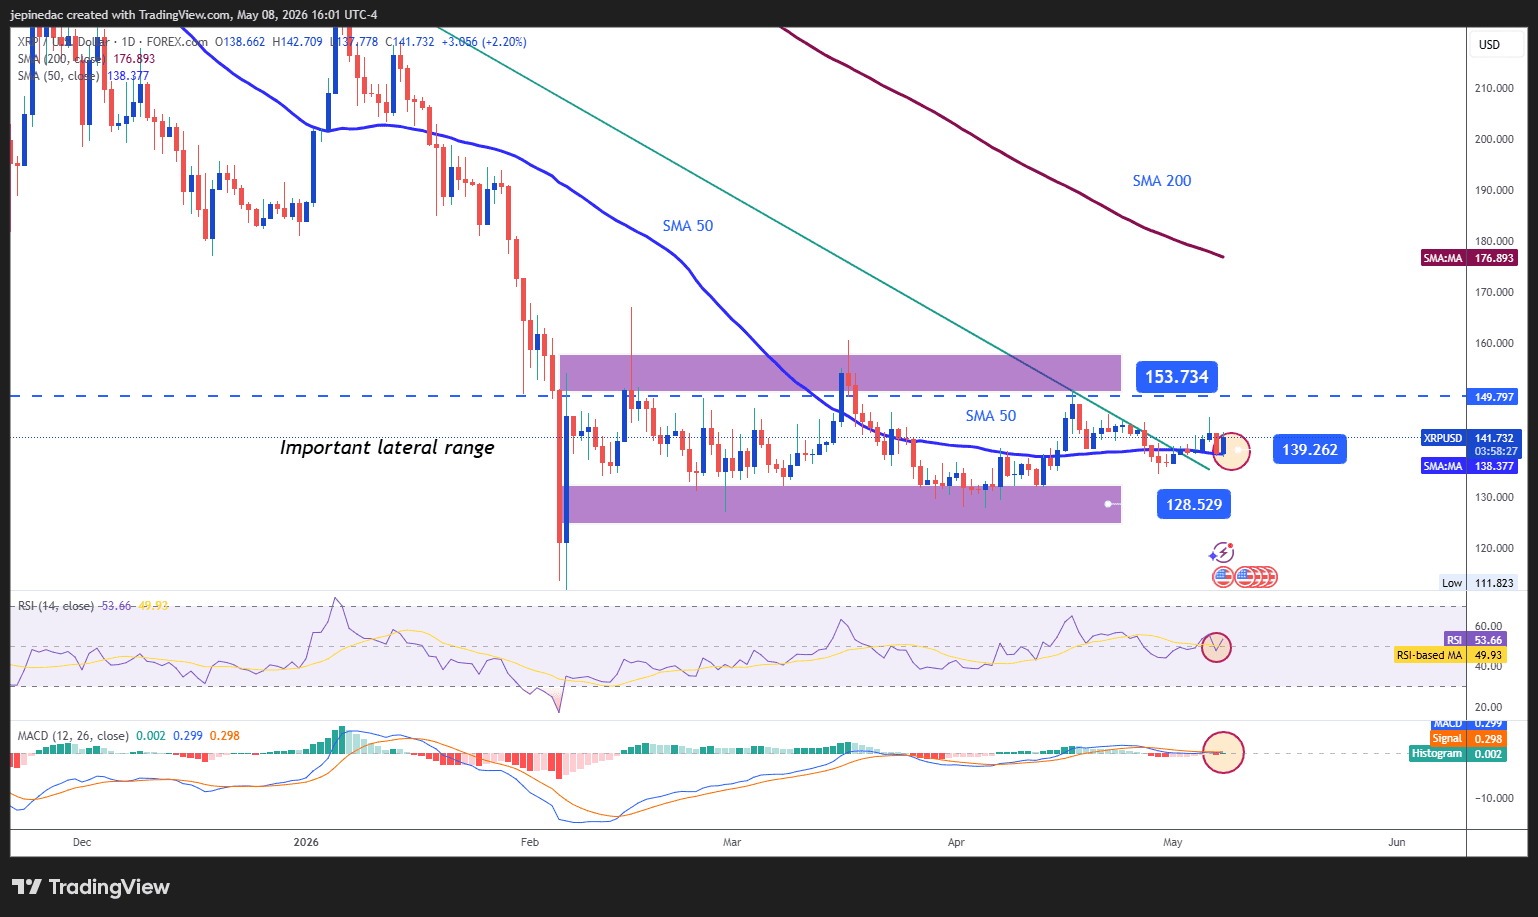
Source: StoneX, Tradingview
Despite attempts to post gains during the week, Ripple has not shown enough strength to break out of its dominant sideways structure. The range between the 153.73 resistance and the 128.52 support remains the key reference, and as long as price stays within these levels, directional moves are likely to remain limited in the short term.
Indicators:
- Both the RSI and MACD remain near neutral levels, indicating a balance between market forces. This reinforces the idea that the current range-bound phase remains dominant and may continue unless stronger signals emerge.
Key levels:
- 153.73 – Key resistance: Corresponds to the most relevant highs and the upper boundary of the range. A breakout above this level could lead to a more defined bullish bias in the coming weeks.
- 139.26 – Near-term barrier: A key neutral level aligned with the 50-period moving average. Price action near this level could continue to reinforce the current range structure.
- 128.52 – Key support: A level of relevant 2026 lows acting as the lower boundary of the range. A break below this level could trigger a stronger bearish bias and reactivate the previous downtrend.
Written by Julian Pineda, CFA, CMT – Market Analyst
Follow him on: @julianpineda25