
We are one week away from the end of the second month of the year, and so far the overall behavior of the cryptocurrency market has been characterized by consistent neutrality dominating most price movements. Both Bitcoin and the other major cryptocurrencies have begun to show reduced volatility compared to previous weeks, indicating that demand confidence has not fully recovered, but neither has a dominant selling pressure taken control.
Unless most cryptocurrencies regain more meaningful price variation in the coming sessions, the current indecisive environment is likely to continue shaping short-term market movements.

Performance of Major Cryptocurrencies
Source: Data - StoneX, Tradingview
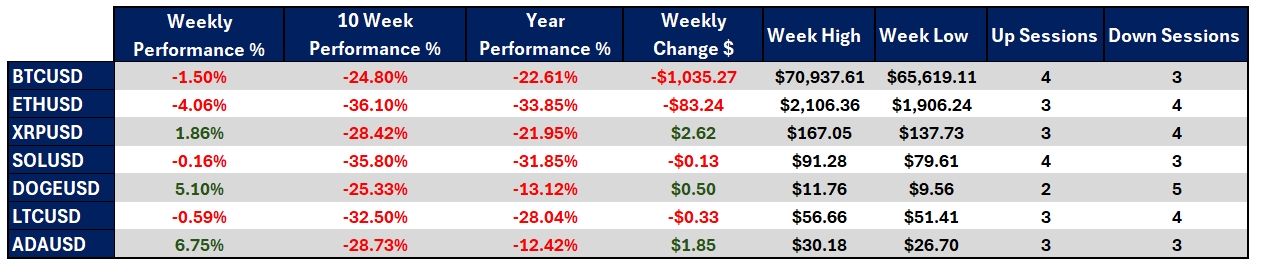
- The most affected cryptocurrency this week has been Ethereum, posting a decline of -4.06% compared to the previous week’s close and positioning itself as the weakest asset in the short term. On the other hand, Cardano has shown stronger performance, rising 6.75% and standing out as one of the few cryptocurrencies attempting to maintain a bullish bias in recent sessions. Overall, the market shows a mixed pattern, with some assets advancing while others remain under pressure.
- Over the past ten weeks, the crypto market continues to trade well below levels seen at the end of 2025, maintaining a dominant bearish bias in the medium term. During this period, Ethereum has declined approximately -36.10%, highlighting its greater sensitivity to downside moves. Meanwhile, Dogecoin has posted a smaller decline of -25.33%, showing relative resilience compared to other major cryptocurrencies.
- Year-to-date, all major cryptocurrencies remain below their opening prices for the year. Ethereum once again stands out as the most affected, with a decline of -33.85%, while Cardano shows relatively better performance, down -12.42%, making it one of the more stable assets so far this year.
- Bitcoin, as the primary market reference, has maintained largely neutral price action compared to the previous week. By the weekly close, it shows a movement of roughly $1,000 per BTC, still far from a consistent recovery. The weekly high barely surpassed the $70,000 level, while $65,000 continues to serve as a key psychological neutrality reference in the short term.
- Overall, the week has been clearly indecisive for the crypto market, reflecting the absence of a solid recovery in short-term confidence. Although some cryptocurrencies attempted to recover part of their recent losses, these moves remain insufficient to reverse the dominant bearish bias of prior weeks.
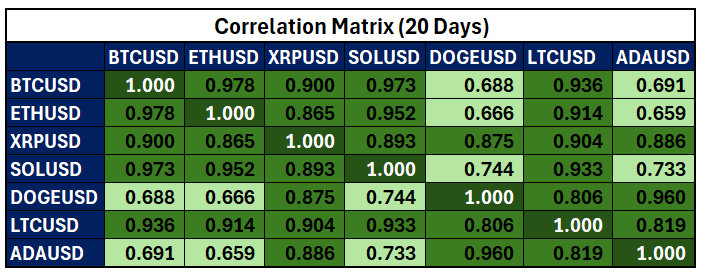
Red to green scale – Red for negative correlations and green for positive correlations
Source: Data - StoneX, Tradingview
From a correlation perspective, some cryptocurrencies have begun to diverge from Bitcoin’s movements. Correlation coefficients such as 0.68 for Dogecoin and 0.69 for Cardano, while still positive, now reflect only moderate correlation compared to the broader market’s relationship with Bitcoin. Additionally, a decline in positive correlation among other major cryptocurrencies has become evident, with some coefficients near 0.65 over the average of the last 20 sessions. It is important to remember that correlation coefficients can change over time.
This behavior suggests that the crypto market is beginning to move away from the highly synchronized patterns observed previously. Rather than maintaining a broad-based positive bias, a mixed structure now prevails, where some cryptocurrencies attempt to stabilize while others continue to show notable weakness.
In this environment, the sense of indecision becomes more pronounced. At present, there is no unified confidence supporting the market as a whole; instead, recoveries appear to stem from isolated rebounds in specific assets. If this loss of correlation and mixed price action persists, a meaningful phase of neutrality could consolidate in the coming sessions, potentially resulting in lower volatility compared to earlier in the year. It may also signal a reduced dominance of Bitcoin as the primary market reference, as investors search for relatively more attractive alternatives in the short term.
Bitcoin Shows Consistent Neutrality
Source: StoneX, Tradingview
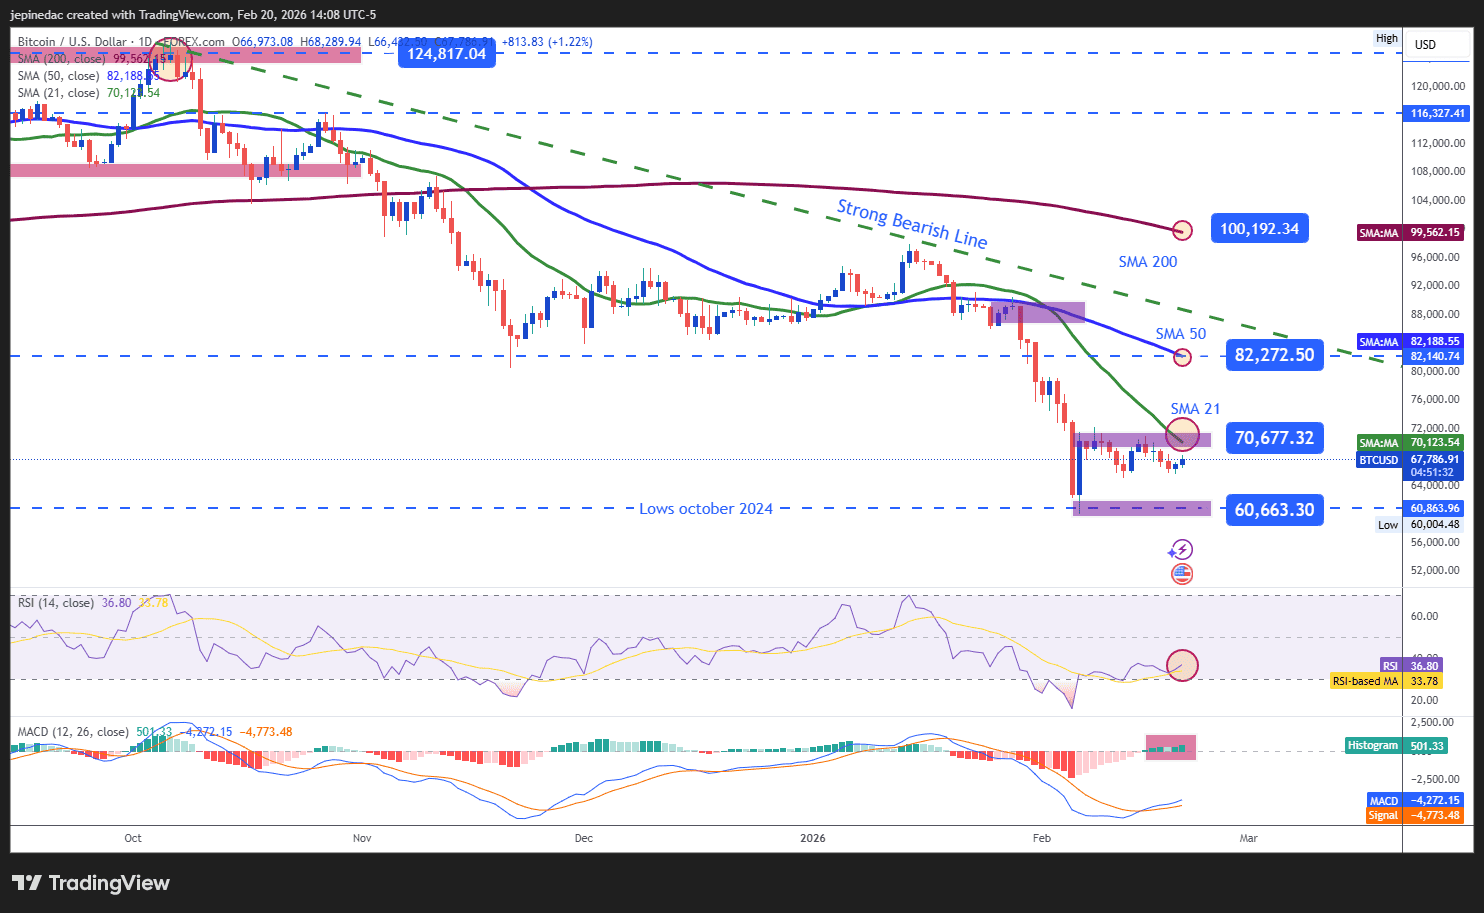
Although Bitcoin remains within a dominant medium-term downtrend, price action has entered a neutral phase that reflects consolidation rather than reinforcing selling pressure.
If bearish momentum fails to regain strength, this neutral phase could even challenge the current descending trendline, potentially giving way to a more clearly defined short-term sideways range.
Indicators:
- The RSI shows a slightly upward slope but remains below the neutral 50 level. Meanwhile, the MACD has begun to register mild movements above the zero line. Both indicators suggest that, rather than showing a dominant bias, the market is currently in an indecisive phase without clearly defined buying or selling strength. Unless stronger technical signals emerge, neutrality may continue to dominate.
Key Levels:
- $84,272 – Key resistance: Aligned with the 50-period simple moving average and near the descending trendline. A sustained move toward this level could challenge the bearish structure and pave the way for a more relevant bullish bias.
- $72,677 – Near-term barrier: A recent neutrality zone aligned with the 20-period moving average. If price fails to move decisively away from this level, a more dominant sideways channel could form.
- $60,600 – Major support: A level not seen since October 2024 and the primary downside barrier. A sustained break below this area could extend the prevailing downtrend.
Cardano Begins to Show Stability
Source: StoneX, Tradingview
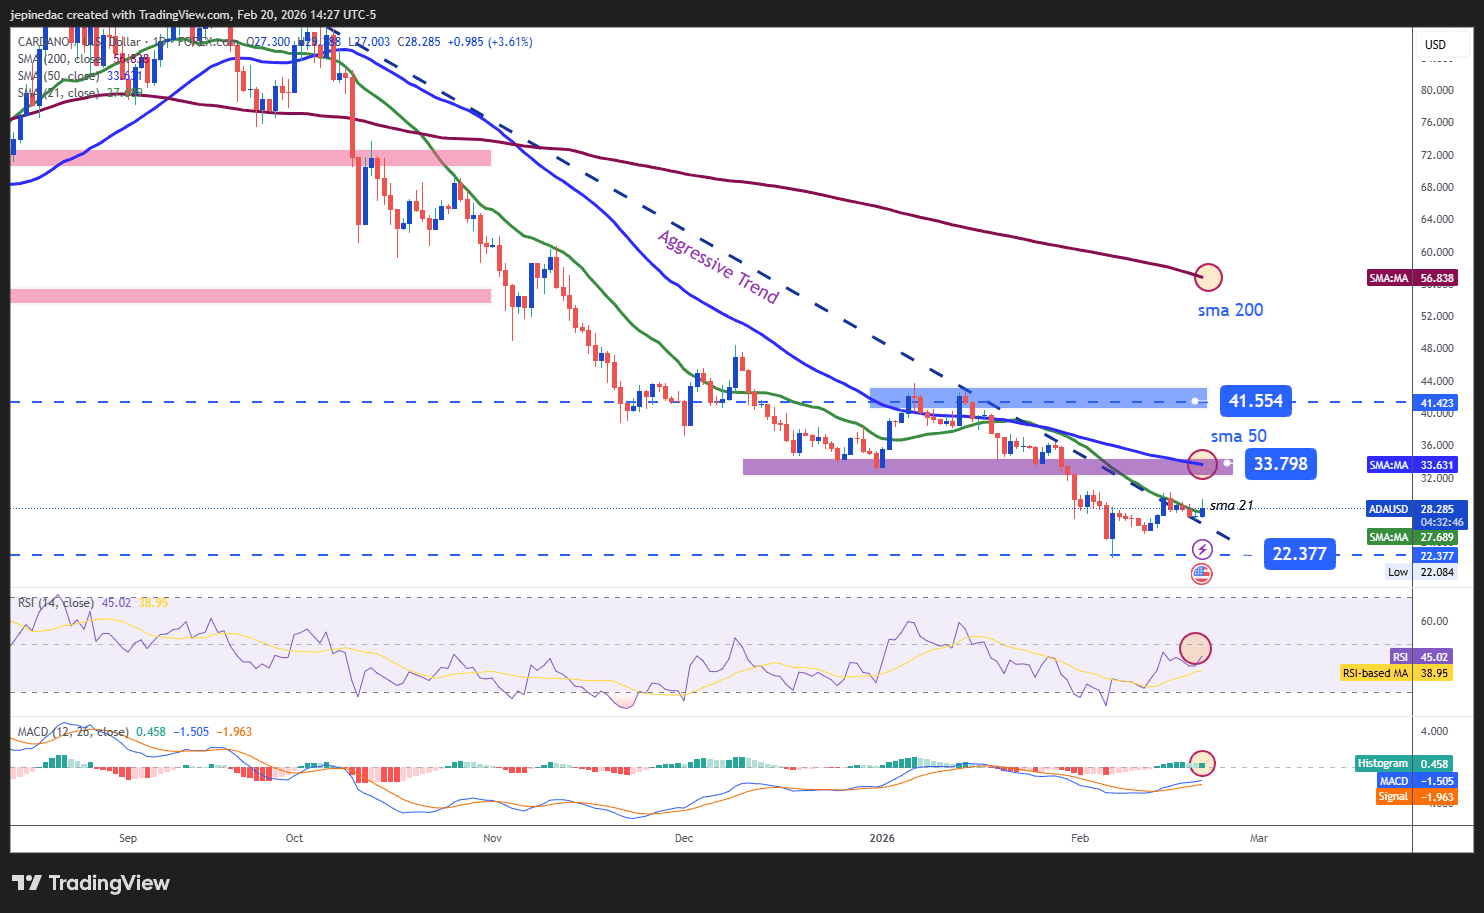
Cardano remains the cryptocurrency that has achieved the most consistent recovery in recent sessions. It is one of the few assets showing bullish oscillations that could begin to challenge the prevailing downtrend that has been in place for several months.
If this recovery consolidates, it could lead to a more structured neutral phase, reducing the dominance of the previous bearish bias.
Indicators:
- The MACD shows a histogram above the zero line, while the RSI is approaching a bullish crossover above the 50 level, suggesting emerging buying momentum. If both indicators continue strengthening, a more meaningful bullish pressure could develop in upcoming sessions. However, if momentum stabilizes without acceleration, it may also signal a prolonged indecisive phase.
Key Levels:
- 22.37 – Key support: A recent low acting as the main downside barrier. A return to this level could reactivate bearish pressure and extend the current downtrend.
- 33.79 – Near-term barrier: Aligned with the 50-period moving average. A move toward this zone could challenge the prevailing downtrend and support a more relevant bullish bias.
- 41.55 – Major resistance: Aligned with January highs. A sustained move toward this level could signal a structural shift on the chart and enable a short-term bullish trend.
Written by Julian Pineda, CFA, CMT – Market Analyst
Follow him on: @julianpineda25