

EUR/USD rises as lower oil prices offset weak German retail sales
The euro/U.S. dollar is rebounding from its 2026 low amid improving risk appetite as oil prices fall back from recent highs. Tech stocks are recovering, helping to offset disappointing German retail sales figures.
German data showed that retail sales fell 2% month-on-month in September, following a 1.2% increase in August. This was against expectations of a 0.4% gain.
However, the weaker data has been offset by a decline in oil prices, which is easing some fears over the stagflationary impact of high energy prices. Oil is falling over 2% on Monday, trading around $110 a barrel as Qatari mediators continue working in Iran to resume U.S.-Iran peace negotiations.
Meanwhile, the U.S. dollar is falling as attention turns to the U.S. midterm elections tomorrow. A recent poll points to a Democrat victory in Congress, as voters remain frustrated by the higher cost of living and escalating petrol prices. Meanwhile, the Senate is expected to be a closer contest.
A clear Democrat victory could weigh on data centre and AI infrastructure plans, which are facing rising opposition across the country.
Beyond the midterm elections, there is plenty of data to watch, including U.S. ISM manufacturing figures today and services PMI on Wednesday, followed by the all-important nonfarm payroll report on Friday.
Eurozone manufacturing PMI data later today, together with services PMI on Tuesday and inflation later in the week, also makes for a busy economic calendar.
EUR/USD forecast – technical analysis
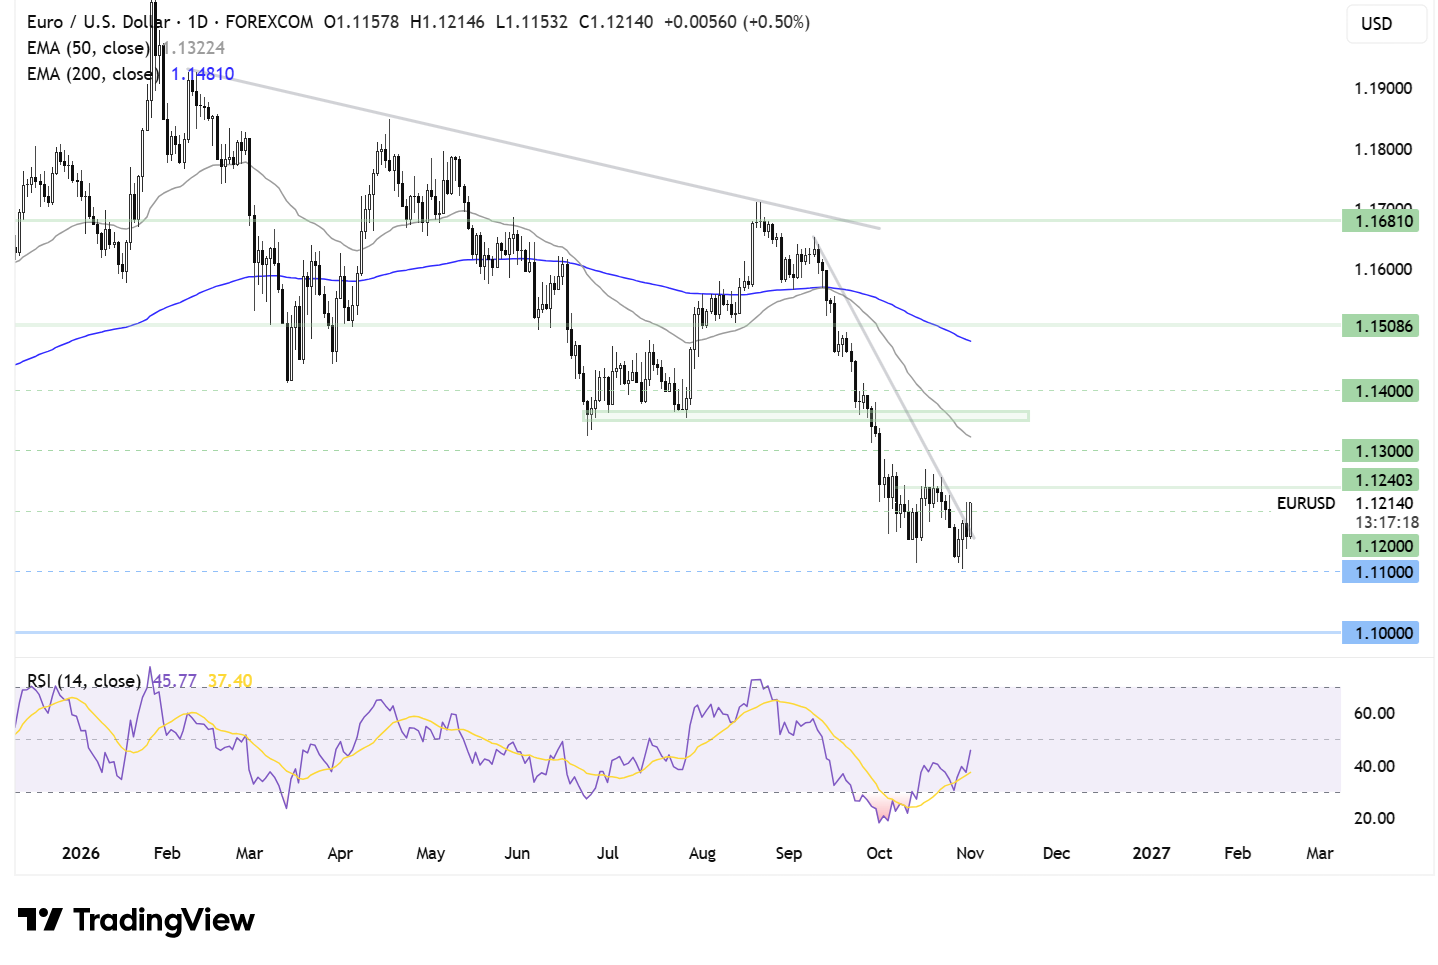
Euro/U.S. dollar found support just above 1.11 and has rebounded higher, pushing above its falling trend line and 1.12, helping the near-term outlook to stabilise.
Should bullish momentum continue to rise, buyers will look to break above 1.1240 before turning attention to 1.13 and the 50 EMA at 1.1325. Above here, the outlook becomes more constructive.
Sellers would need to break below 1.1150 support and 1.11 to create a lower low.
Gold rebounds after worst October in 18 years
Gold is rebounding on Monday as dip buyers step in following its worst October performance since 2008, and as falling oil prices ease some inflationary concerns.
Gold is trading around $3,900 at the time of writing, but this is a very small bounce compared with last month's 6% decline. The price is now some 28% below its record close of $5,420 on January 28.
Gold has been hit by expectations that interest rates will remain higher for longer after U.S. core PCE data came in at 3.1% and U.S. GDP data came in stronger than expected.
Hot data, combined with a 14% increase in oil prices across October, will keep pressure on the Federal Reserve to hike rates further. This is bad news for non-yielding gold.
Last week, the Federal Reserve left interest rates unchanged but highlighted risks to inflation, keeping expectations of a December hike on the table.
Furthermore, the sell-off in tech stocks last week also pushed some investors to sell precious metals to cover those losses. While a typical stock market sell-off sends money into safe-haven assets such as gold, this time a sharp sell-off fuelled a rotation out of gold to cover positions.
Today, oil prices are falling after Iran and Qatar held a third day of talks on Sunday, and President Trump is giving diplomacy more time. Lower oil prices mean less inflationary pressure, which could be beneficial for gold if they take some of the heat off the Fed.
Still, this week will be a busy one, with the U.S. midterm elections tomorrow and the key nonfarm payroll report on Friday. Strong jobs numbers could see Fed rate hike expectations jump and put further pressure on precious metals.
Gold forecast – technical analysis
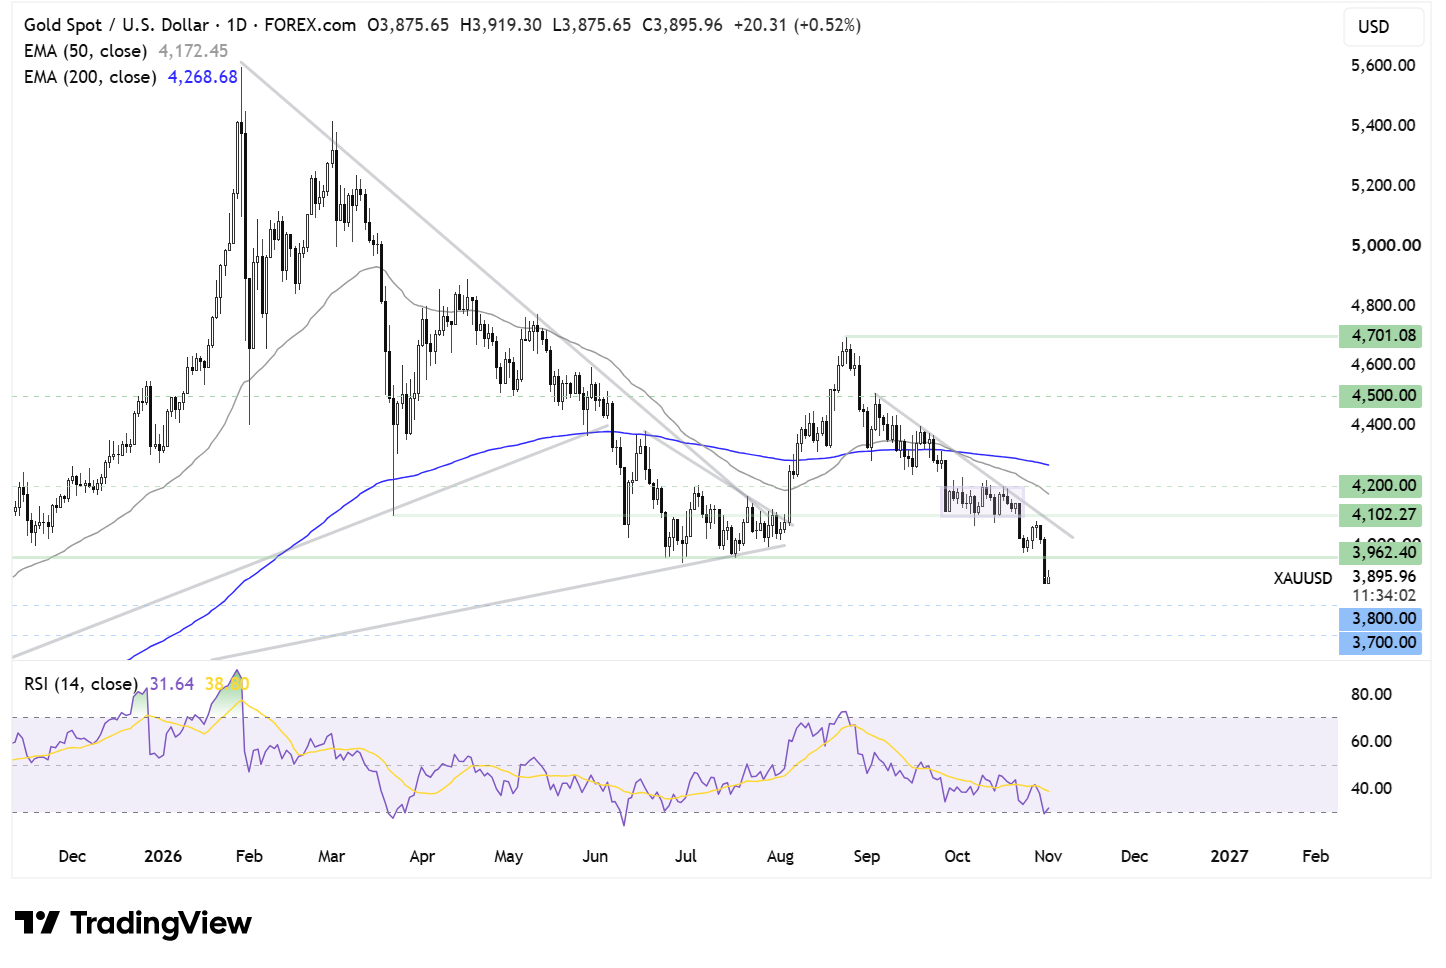
Gold trades below its falling trend line, its 50 EMA and its 200 EMA, maintaining a bearish picture. The price fell to a 2026 low of $3,870 and has since edged higher to $3,900 at the time of writing, keeping the RSI out of oversold territory.
Any meaningful recovery would first need to break 3,960, the June low, followed by the falling trend line and horizontal resistance at 4,100. From here, attention could turn to 4,200, the 50 EMA and horizontal resistance.
On the downside, should sellers stay in control, support can be seen at 3,800 and 3,720.