


Euro, EUR/USD Talking Points:
- EUR/USD had built both a bull pennant and an inverse head and shoulders pattern after spending the first two months of Q3 digesting into a symmetrical triangle. With bulls stepping up to a fresh monthly high on Friday after the NFP report, the door is now open for continuation with the big question as to whether the trend can finally continue.
- Behind the move on the fundamental side have been growing expectations for more and more rate cuts from the Fed, which are expected to start at their next meeting on the 17th. Until then, we get one more CPI print on Thursday of next week which follows an ECB rate decision with the bank expected to hold rates flat.
The rally in EUR/USD was probably surprising to many based on how the pair had limped into the New Year. While parity calls were plentiful on January 1st it was just a couple weeks later that EUR/USD set support at a key Fibonacci level around 1.0200. With impending tariffs and a massive USD rally it seemed to be but a speed bump, but after a higher-low developed in February and recession fears started to show in the U.S. in March, the pair was primed for reversal that’s largely continued into current date.
At this point EUR/USD has continued to grind-higher along the lines of the 2021-2022 major move, and this was a Fibonacci retracement I used as an example of the technical tool back in February.
The 78.6% retracement of that major move was back in-play this morning as the pair perched up to a fresh monthly high. But, also of note was the fact that prices had broken above a key trendline that marked both the neckline of an inverse head and shoulders pattern as well as the resistance side of a symmetrical triangle that made up a bull pennant formation.
Like I had said in the video on Thursday, this opens the door for bulls to make a push and that’s the hot button for early next week, ahead of the Thursday release of CPI taking place just after the ECB rate announcement.
EUR/USD Weekly Price Chart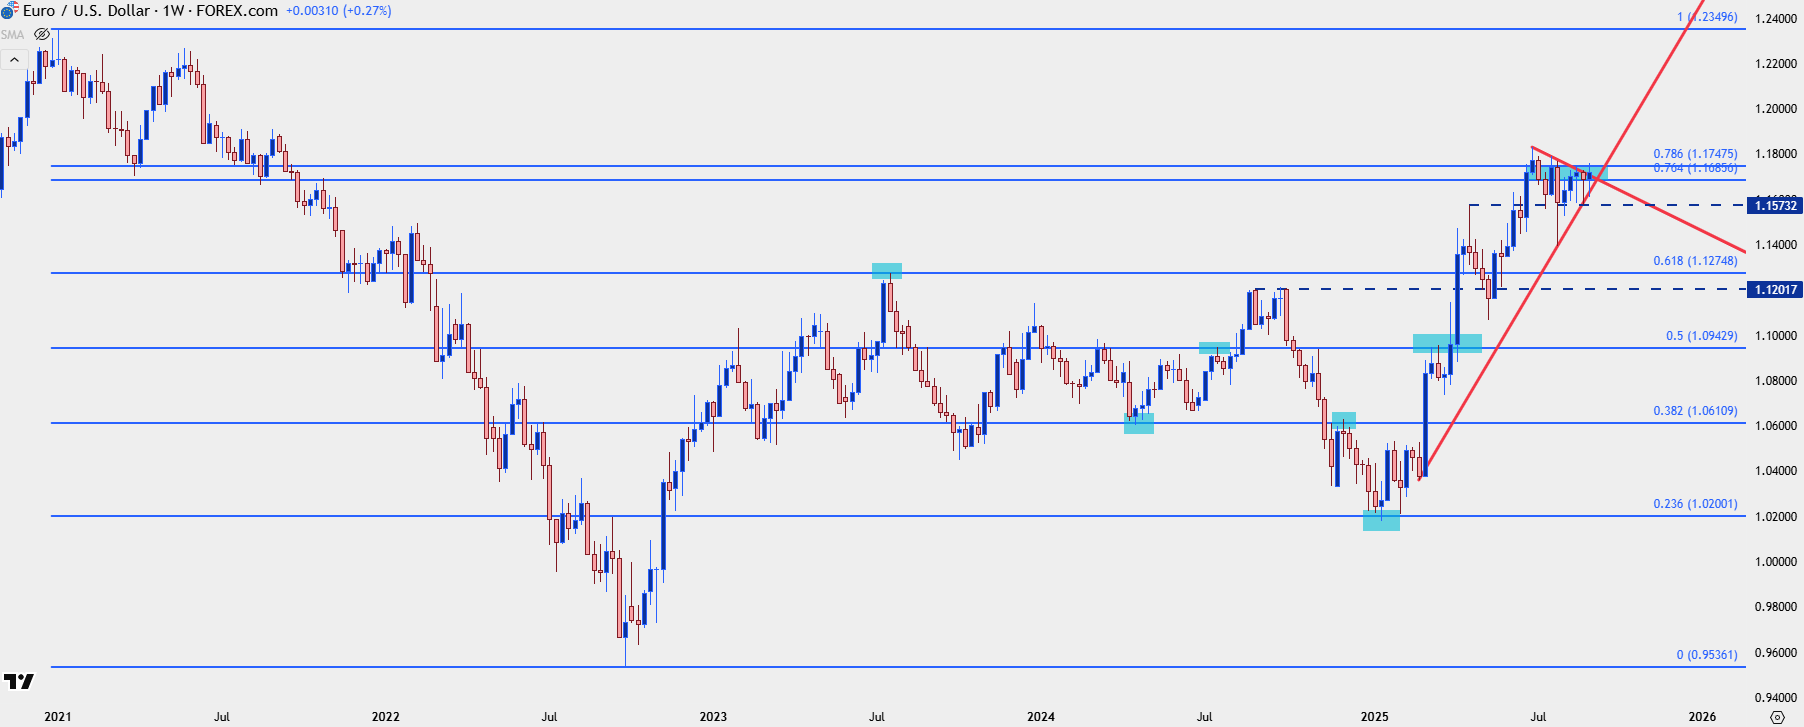
Chart prepared by James Stanley; data derived from Tradingview
EUR/USD
The daily chart is where the inverse head and shoulders pattern starts to show and this is accented with a descending trendline as the neckline of the formation. That trendline was broached by the NFP-fueled breakout earlier on the day; and the pullback could be driven by either longs taking profits or bears taking their shot, although there’s probably a combination of the two forces at work.
The bigger question is whether bulls hold in here and continue that move into a sequence of higher-highs and lows, and as we move into next week, that places emphasis on the 76.4% retracement from the setup at 1.1686, and then below that at 1.1613.
EUR/USD Daily Chart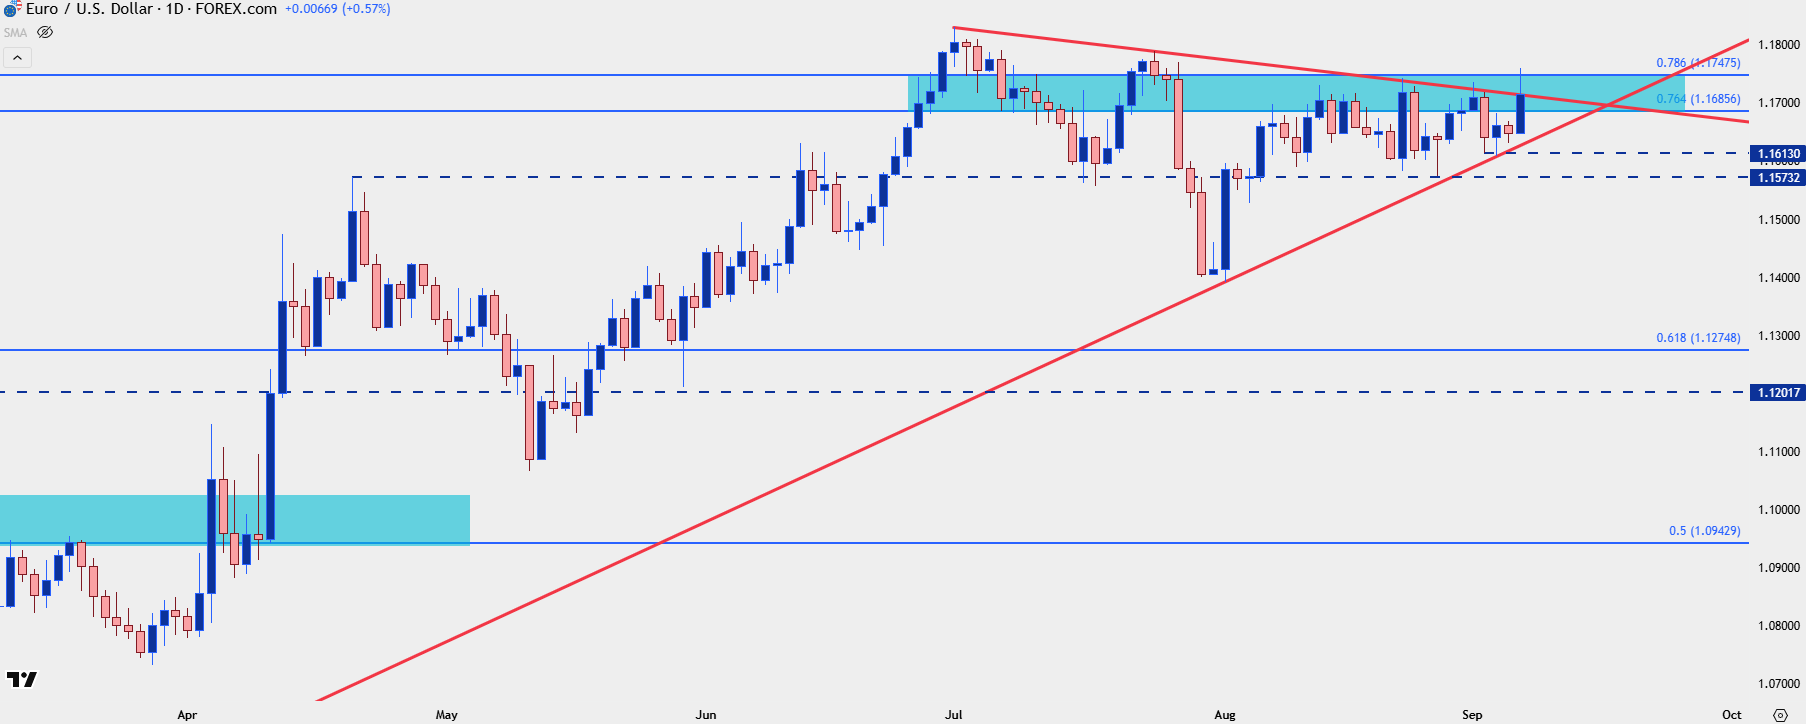
Chart prepared by James Stanley; data derived from Tradingview

EUR/USD Short-Term
From the four-hour chart we can get better view of that recent high but perhaps more importantly this also illustrates structure leading into the break.
While sellers have so far responded to the key Fibonacci level at 1.1748, the bigger question now is whether the higher-low pattern can continue. Ideally, if this is going to lead into continuation, prices pulling back to a higher-low would be perceived as a relative value from bulls and lead to a rush of demand at a level above the prior swing low of 1.1613. Given the Fibonacci level at 1.1686, there’s an ideal area for this to take place at.
If we do see a breach of 1.1613, it’s not necessarily game over for bulls as there’s another significant swing low at 1.1573 that held the late-August low; but if buyers can’t defend that price, then the NFP-fueled breakout will start looking like a failure and reversal themes can start to take on favor.
EUR/USD Four-Hour Chart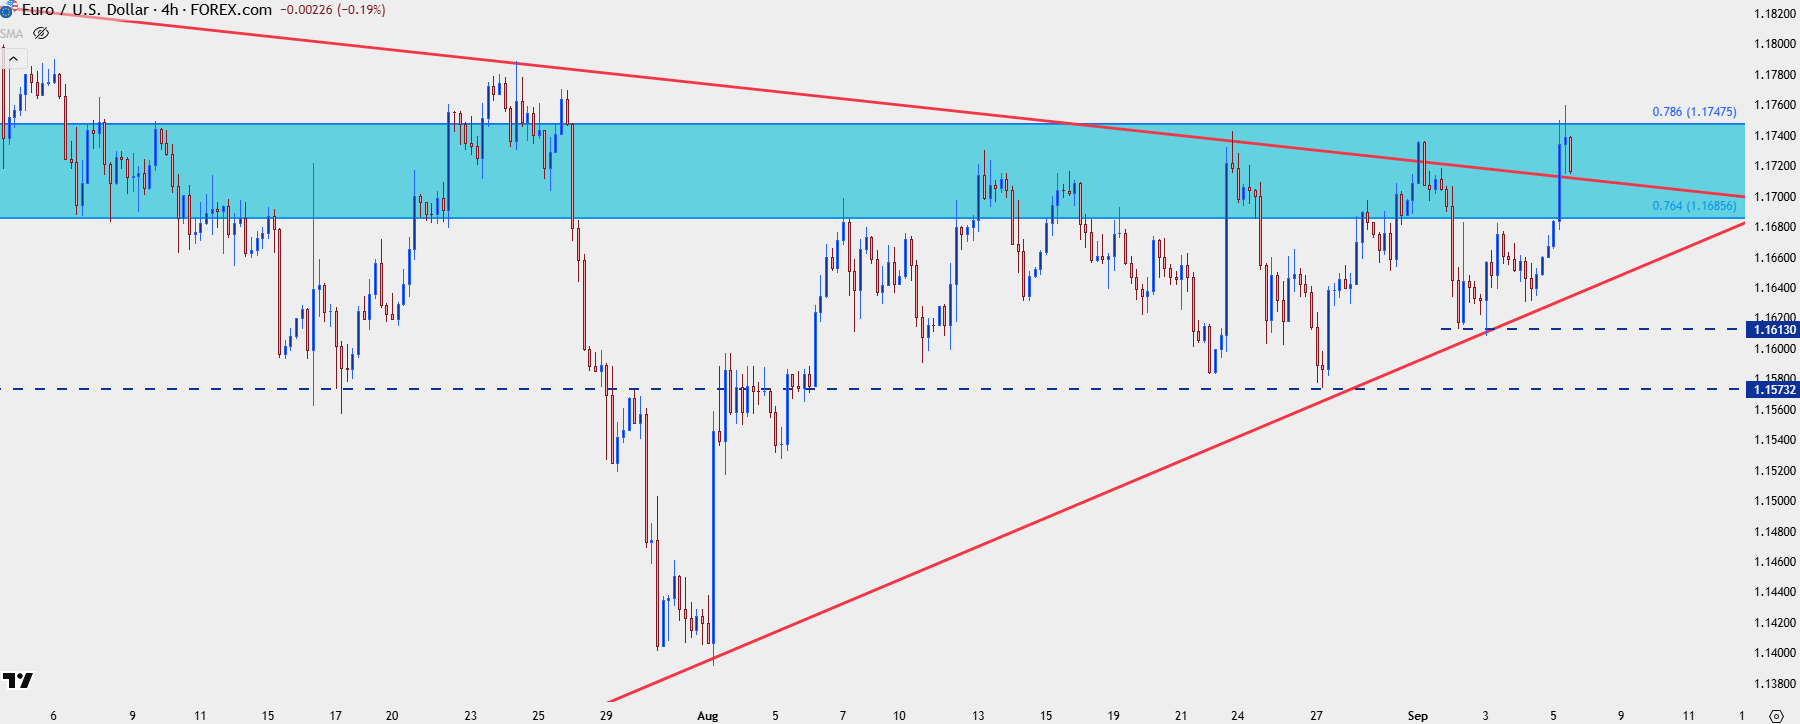
Chart prepared by James Stanley; data derived from Tradingview
--- written by James Stanley, Senior Strategist






