


The sell-off in EUR/USD stalled last week but bulls responded with a breakout from a short-term double bottom formation. EUR/JPY, on the other hand, retains clean bullish structure, with re-test of the 175.00 psychological level as support ahead of the end of the week. EUR/CAD similarly retains dovish lean, and I’ll look at all three Euro pairs below.
EUR/USD 1.1631 is Vital for USD Trends
The weekly chart of EUR/USD remains fairly messy and this is much to the chagrin of FX traders around the world. The major pair is a big piece of the puzzle as the Euro makes up 57.6% of the DXY quote, and as such, when the pair is range bound there can be a seeming lack of trend elsewhere. That’s largely been the case since July 1st, when EUR/USD punched up to a fresh three-year-high on the first day of Q3. A pullback ran cleanly through July but as soon as the US NFP report dropped on August 1st, its been a grinding range-bound affair.
More recently, hope for trend arrived in the form of a bearish break, following the reversal that initiated right when the Fed announced their rate cut in September. That brought in a lower-low last week, with the same exact price holding the low this week while producing a double bottom formation.
I spoke of that in the Tuesday webinar and then again in the Friday video (linked above), but that weekly chart still remains as indecisive and this puts pressure on price for next week. The 1.1748 level remains a key spot for EUR/USD bears as this held the high for five consecutive days before the breakdown into lower-lows. That level now serves as a form of invalidation for bears.
EUR/USD Weekly Chart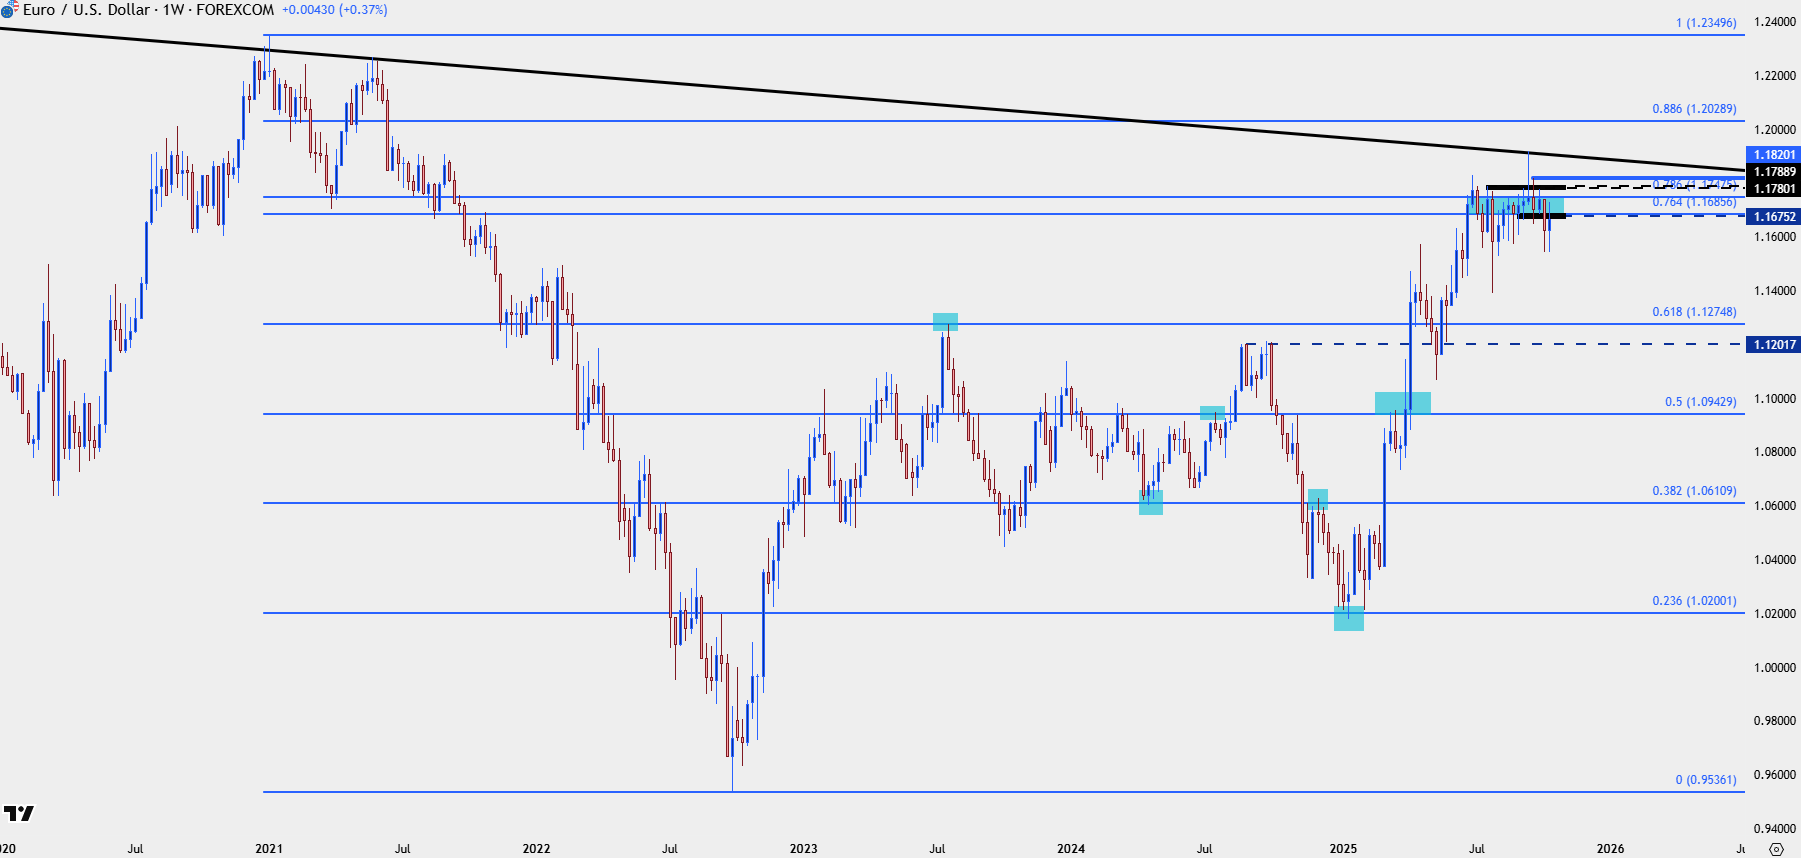
Chart prepared by James Stanley; data derived from Tradingview
From the above weekly chart, it’s the Fibonacci levels at 1.1686-1.1748 that stand out. This is the 76.4 and 78.6% retracements of the 2021-2022 major move, and they’re related to the 23.6% retracement that held support back in January. I looked into this Fibonacci setup in the evergreen article on the topic, and since then, this current zone of resistance has become like a brick wall for bulls that remains in-place today.
Perhaps more importantly, these Fibonacci levels helped to craft the lower-lows and highs that sets up the current sequence, and from the daily, there’s still the possibility of bearish continuation, provided that sellers can defend that structure.
From the daily, this retains the look of lower-lows and lower-highs, but a break above 1.1748 negates that. And, from shorter-terms, there can be another observation that highlights a significant level of possible support.
EUR/USD Daily Chart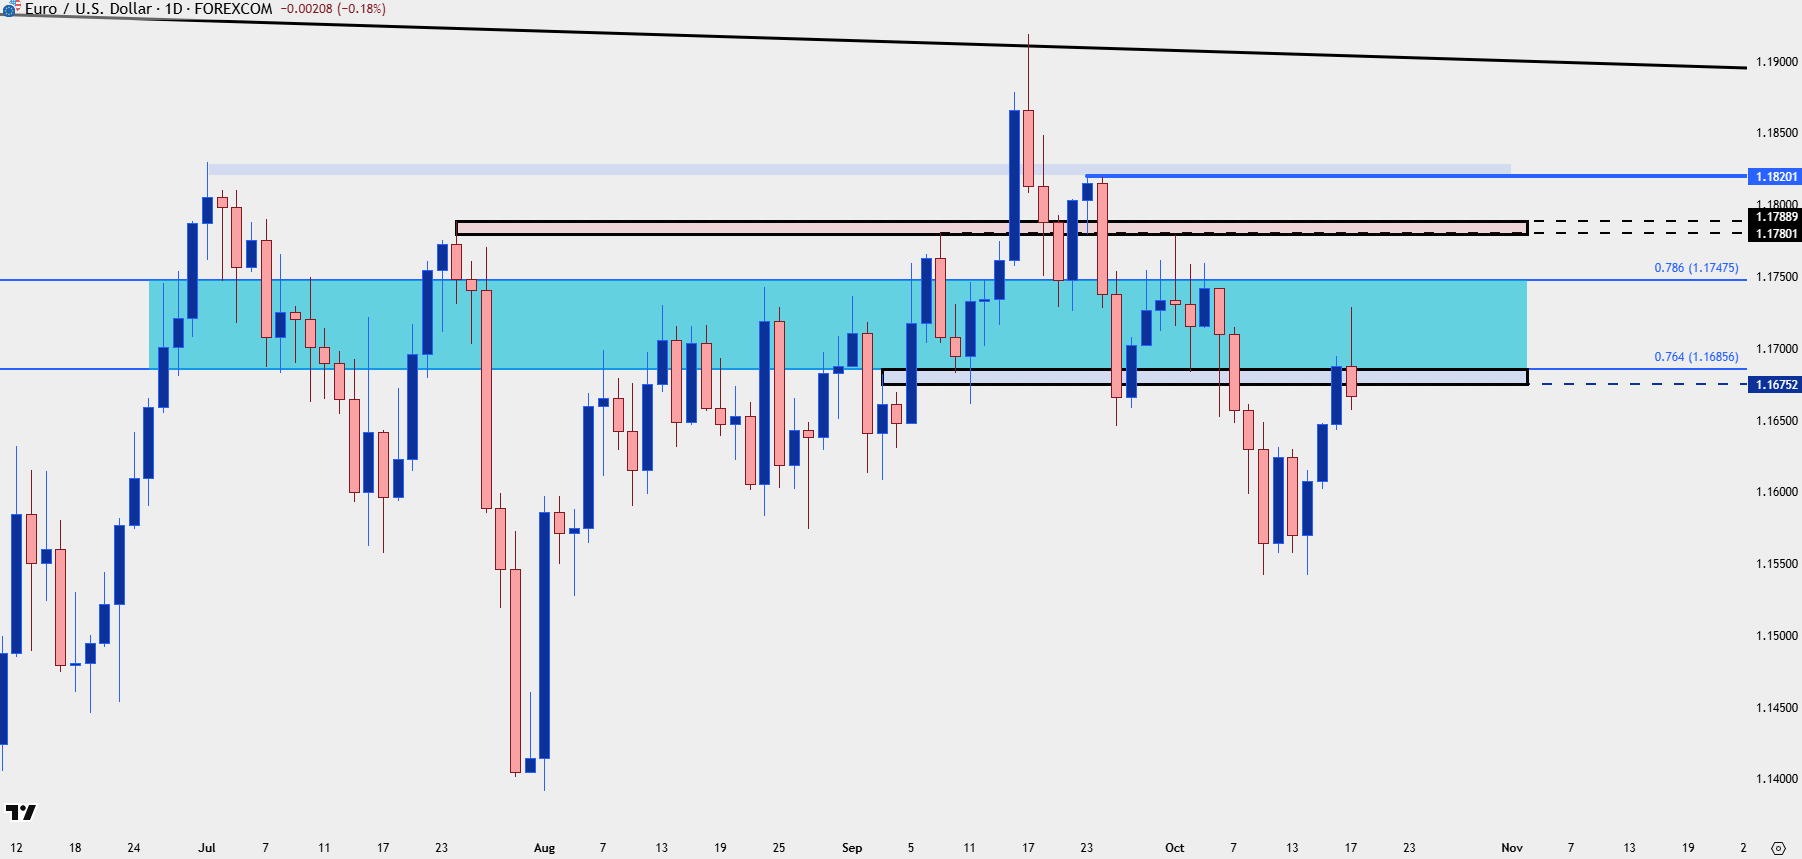
Chart prepared by James Stanley; data derived from Tradingview
In the Tuesday webinar I said that one of the main benefits of price action is its objectivity. It doesn’t care what I want and, instead, its up to me to read it without bias in effort of devising strategy. At the time, there was a perfect hold of the prior week low, and that set up a possible double bottom formation. These are often tracked with aim of bullish breakout, looking for a breach of the neckline, or the high between the two lows, to trigger into breakout setups. And then the distance between the bottoms and neckline is usually tracked for a projection of that move.
As I showed in the webinar this pointed towards 1.1720, which came into play early on Friday morning. So the formation filled in and ran to the projected target, and from the four-hour chart, this shows a higher-high and low sequencing on short-term charts.
It also highlights the neckline from the formation, at 1.1631, as a key spot for bulls to hold to retain that sequence. So, as said in the video for USD this week, if sellers can sink below that 1.1631 level, the bearish sequence on the daily chart will take on more attraction, as it illustrates sellers taking greater control. Or, conversely, if that holds, and bulls can run up and through 1.1748, the shorter-term setup will negate the bearish sequence, thereby opening the door for bulls to continue with the push.
This puts a lot of importance on that 1.1631 level for next week, but also as looked at in the video, there may be more amenable pastures for Euro-strength elsewhere, such as EUR/JPY. Or, as discussed in the article earlier on the day, EUR/CAD.
EUR/USD Four-Hour Chart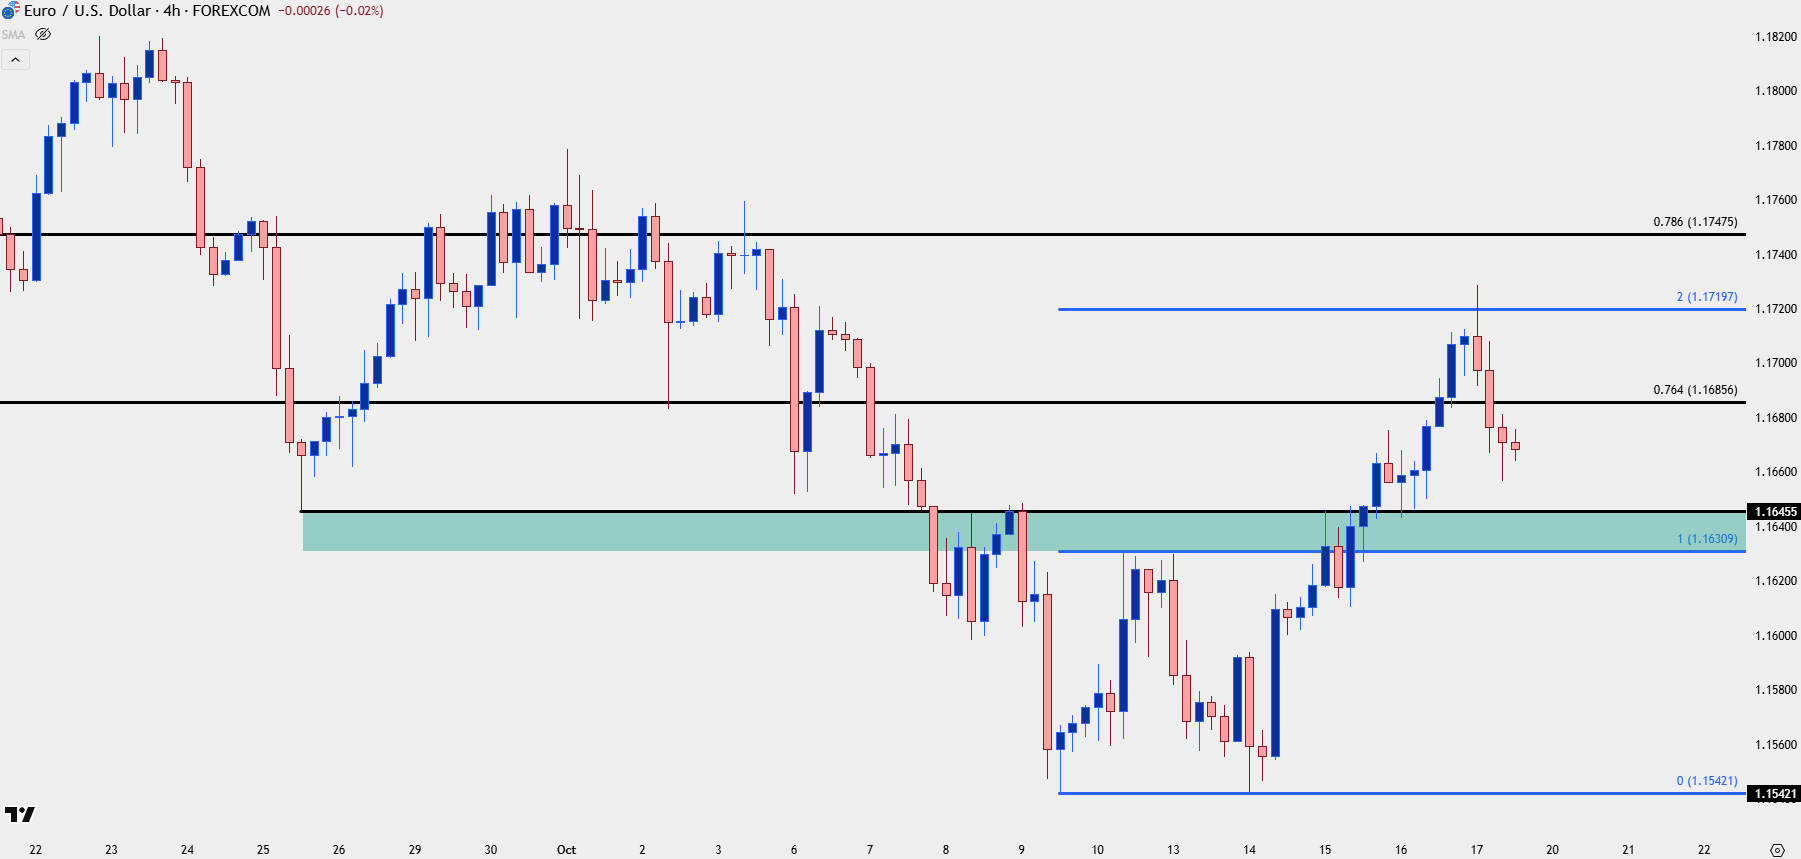
Chart prepared by James Stanley; data derived from Tradingview
EUR/JPY
USD/JPY set its current yearly low in April at the 140.00 handle, and USD/JPY is now testing the 145.00 handle after a decisive sell-off this week. But – that’s still 500 pips above the April swing low even as DXY remains somewhat near its own April low. This highlights the deduction of Yen-weakness and if looking for Euro-strength, that may be a better theme to work with than the tenuous backdrop in EUR/USD above.
In EUR/JPY, the pair has pulled back and so far held support at the 175.00 level, which set the highs in late-September. That resistance led to a pullback and show of support at the 61.8% retracement of the July sell-off, followed by a massive rally up to fresh highs. For three days of the past week, support held at the 2024 high of 175.43, but the Friday pullback tested below that and was followed by a strong response from bulls.
This retains bullish structure for the pair and it’s that 175.00 level that bulls need to hold to keep the door open for topside continuation.
EUR/JPY Daily Price Chart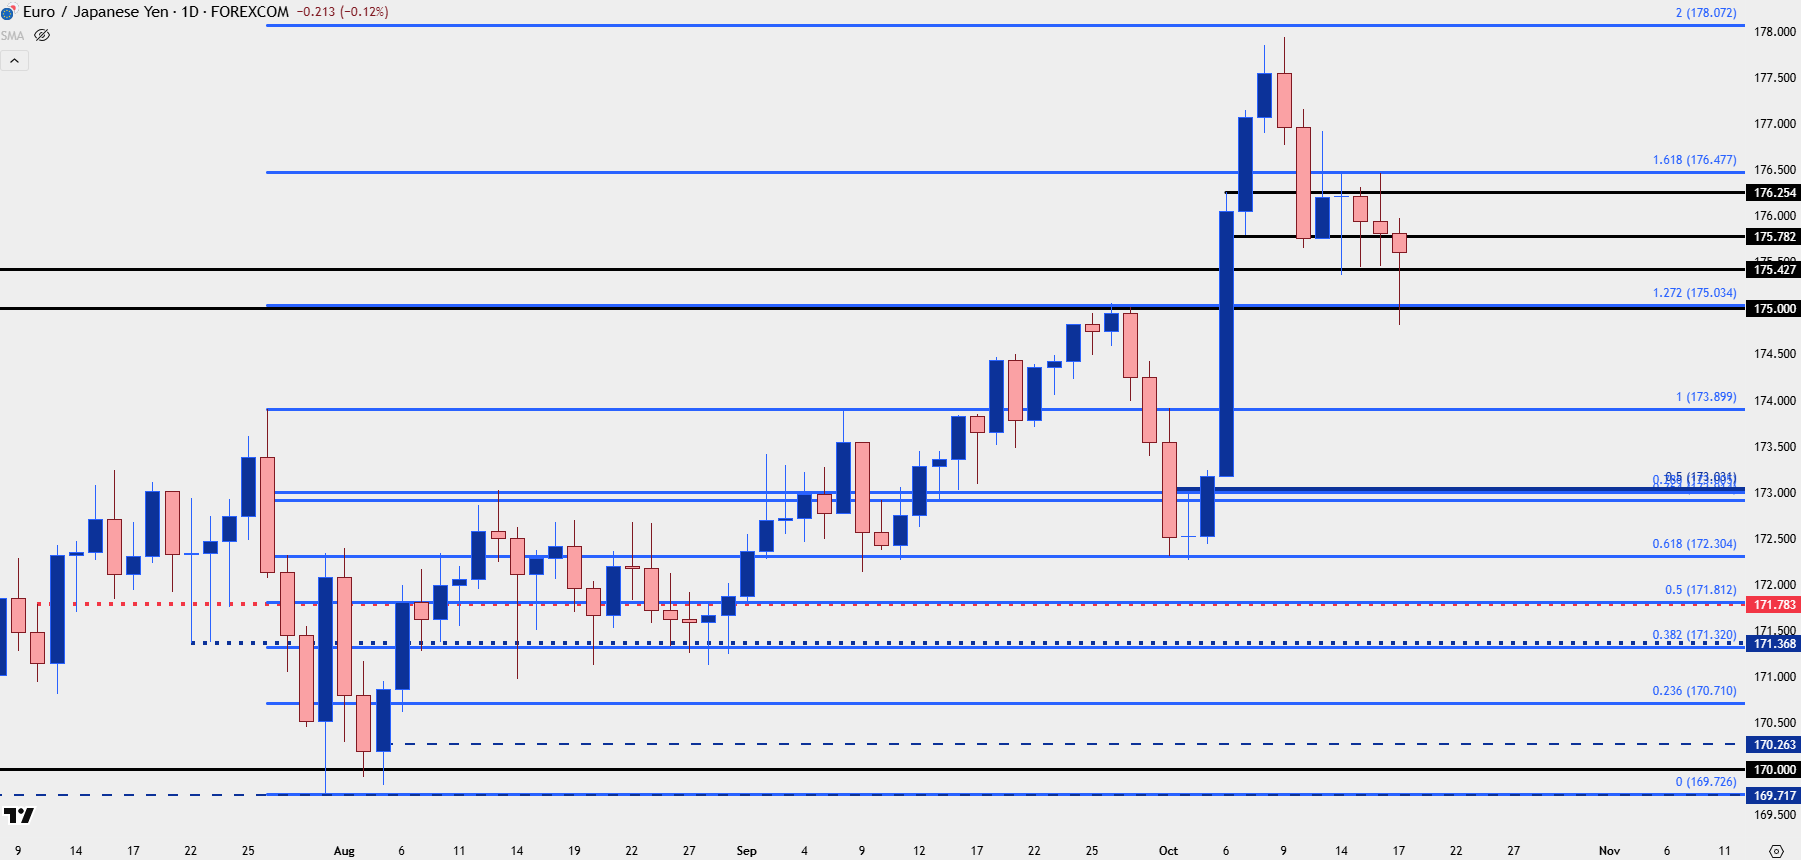
Chart prepared by James Stanley; data derived from Tradingview
EUR/CAD
On that same tune of meshing up weak currencies with potentially strong currencies, EUR/CAD can remain of interest. Similar to USD/JPY above, the major pair has deviated from DXY with USD/CAD setting a fresh six-month high this week even as the USD slumped and remained relatively near the fresh three-year lows established last month. But – while USD trends retain a question mark as bulls haven’t been able to drive a convincing rally above 100 in DXY yet, EUR/CAD can remain of interest.
At this point, EUR/CAD is already testing support at prior resistance, and there’s a Fibonacci level of note at 1.6231. Below that, 1.6106 is of interest as support potential taken from prior resistance.
EUR/CAD Daily Price Chart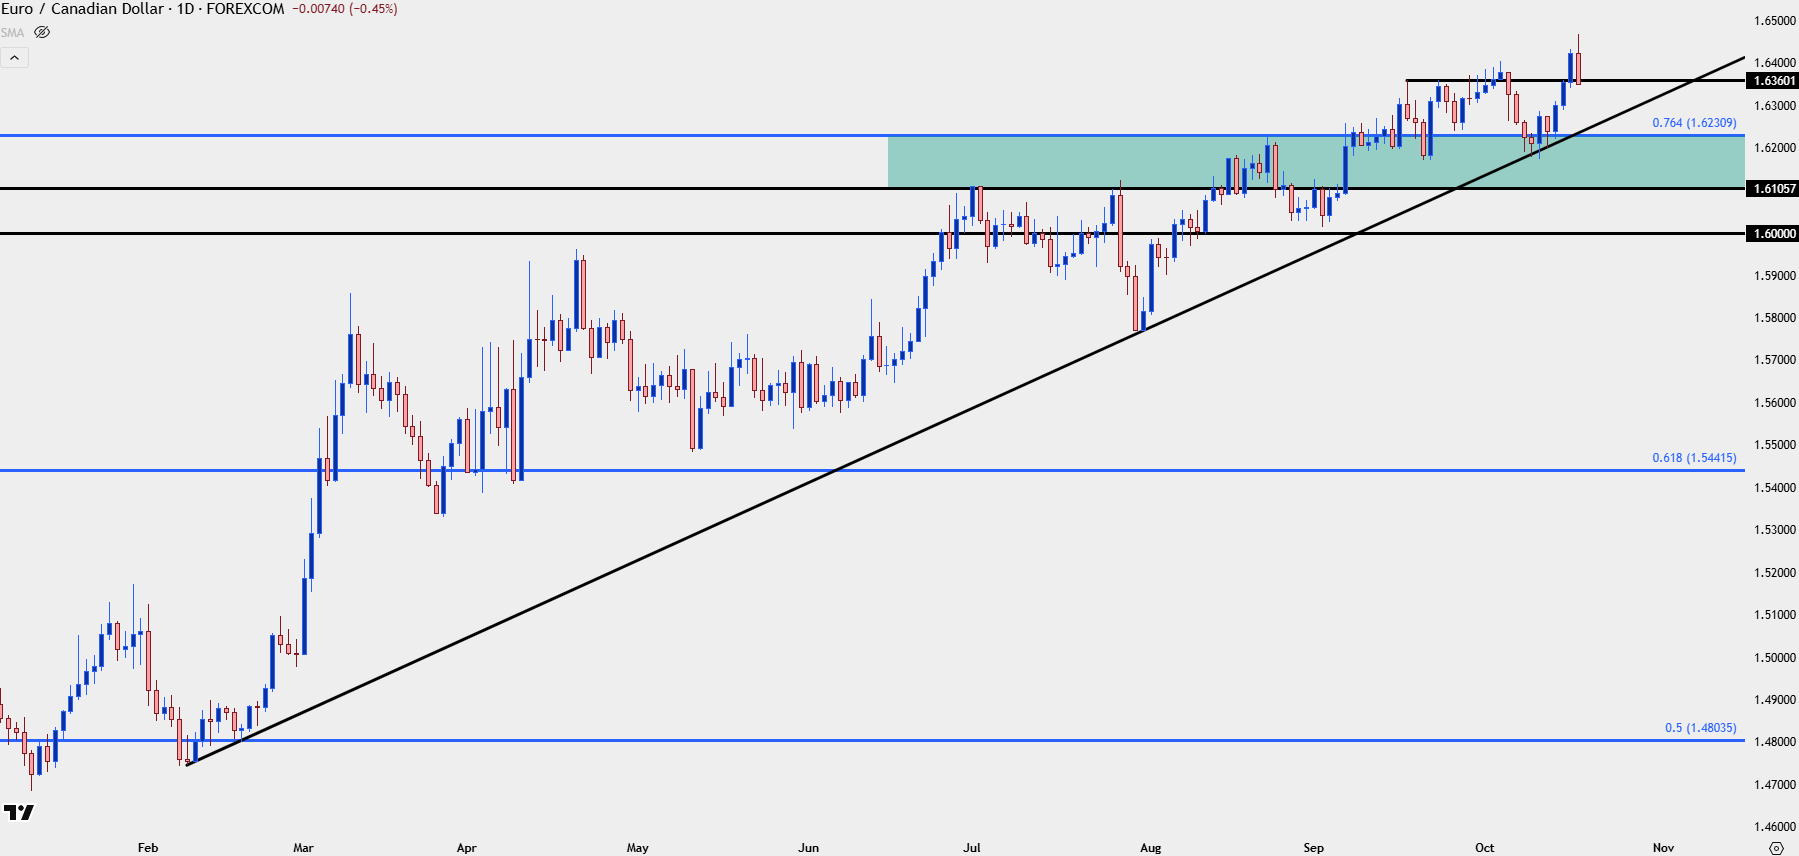
Chart prepared by James Stanley; data derived from Tradingview
--- written by James Stanley, Senior Strategist






