
Euro, EUR/USD Talking Points:
- EUR/USD has been in a lower-low and lower-high sequence since the Fed’s rate cut but the Euro got a boost after comments from Christine Lagarde yesterday.
- While last week showed a strong push from sellers, that move has stalled since the Friday pullback, helped along by the increased tariff threat from President Trump.
- While the lower-low and high sequencing remains in-place, prices are now testing resistance at prior support in EUR/USD, with a couple of additional spots sitting overhead.

EUR/USD is an important part of the USD complex as the Euro makes up 57.6% of the DXY basket. This doesn’t mean that DXY can’t go down if the Euro is weak or vice versa, but it does mean that the bar for both the USD and Euro remaining positively correlated for long is incredibly high. There would probably need to be some significant Japanese Yen and British Pound trend to allow for that to happen, but in many cases there can be a mirror image like dynamic between the Dollar and the EUR/USD pair.
As illustration of that, the US Dollar rally that started in Q4 of last year went hand-in-hand with a EUR/USD sell-off. And the reversal in each market that started in March of this year similarly showed a mirror image dynamic. More recently, the bullish trend in EUR/USD and the bearish trend in DXY have shown symptoms of stalling, and since the Fed’s rate cut last month, reversal. The higher-highs and higher-lows of the USD show well against the lower-lows and lower-highs in EUR/USD, and from the four-hour chart below, we can see that structure still in-place in the EUR/USD pair.
EUR/USD Four-Hour Chart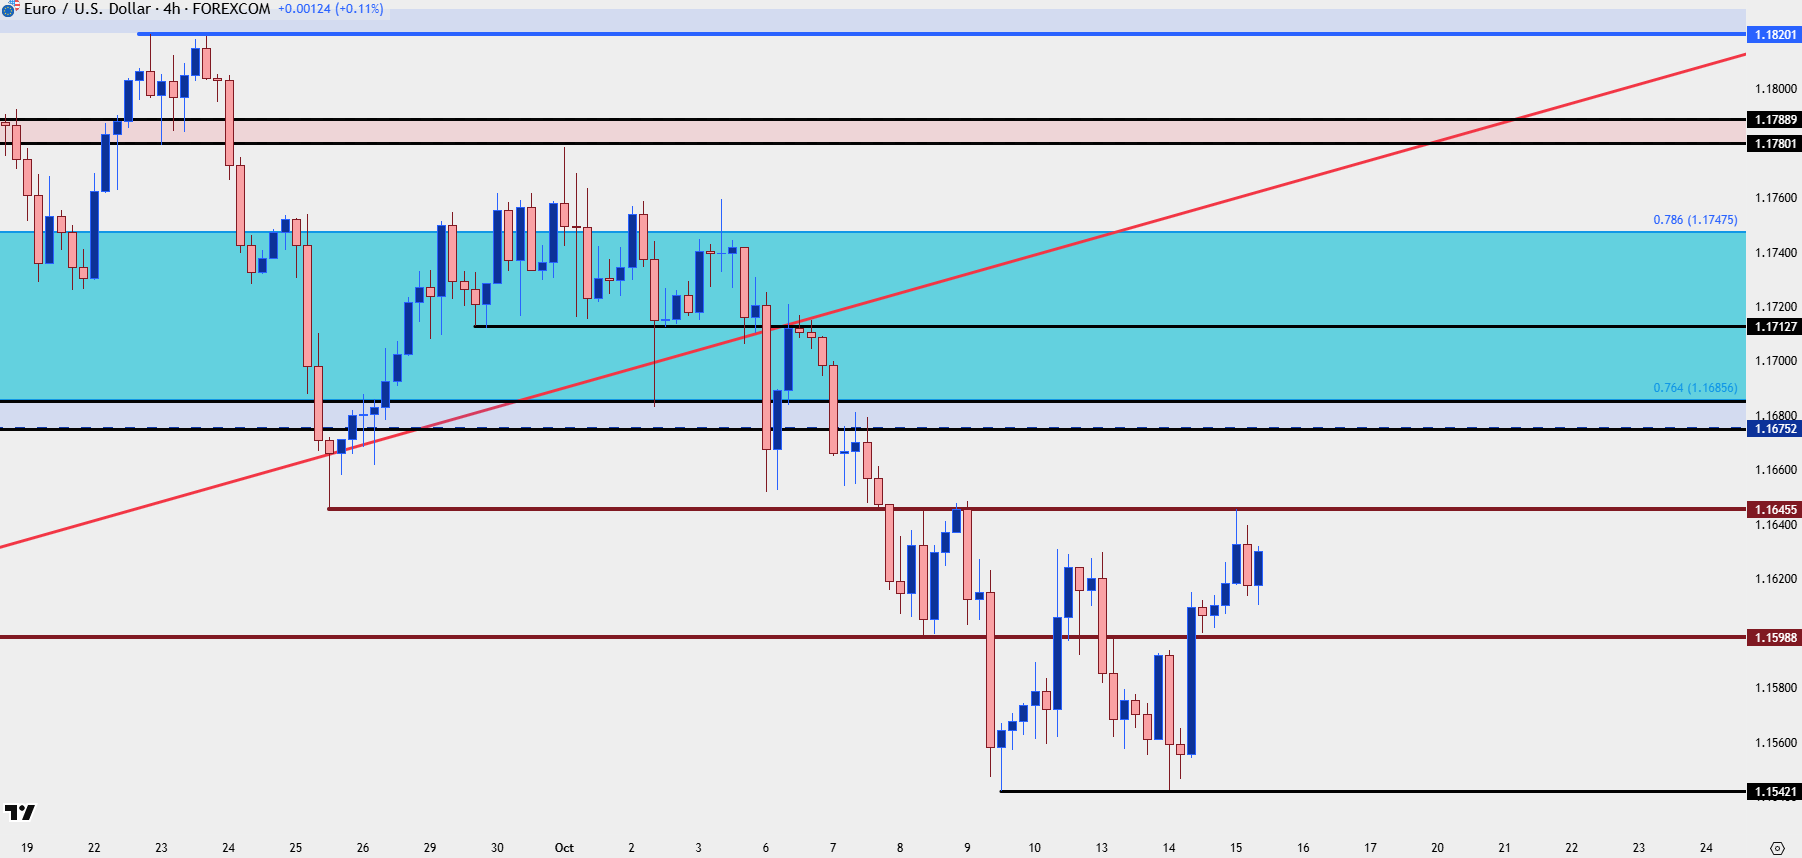
Chart prepared by James Stanley; data derived from Tradingview
EUR/USD Daily
Further speaking to that mirror image dynamic, the falling wedge in USD that led to breakout showed with a rising wedge in EUR/USD that did the same last week. Rising wedges are often tracked with aim of bearish reversal, and that’s so far what’s shown after a decisive sell-off following the break of the support trendline.
But now that the sell-off has stalled, the big question is whether bears come in to defend lower-high resistance to continue the move.
For reference, it’s the lower-high at 1.1780-1.1789 that remains a massive spot of contention, and below that, there’s the Fibonacci level of 1.1748 which saw five consecutive days of hold, until the sell-off that took over last week.
As seen from the above chart, there’s already a case of resistance showing at prior support, from the 1.1646 level, and there’s another zone just above that from 1.1675-1.1686. The latter price is the 76.4% Fibonacci retracement of the same major move that produced 1.1748 as the 78.6% marker; and even that price could be seen as a spot of lower-high resistance for bearish continuation.
EUR/USD Daily Chart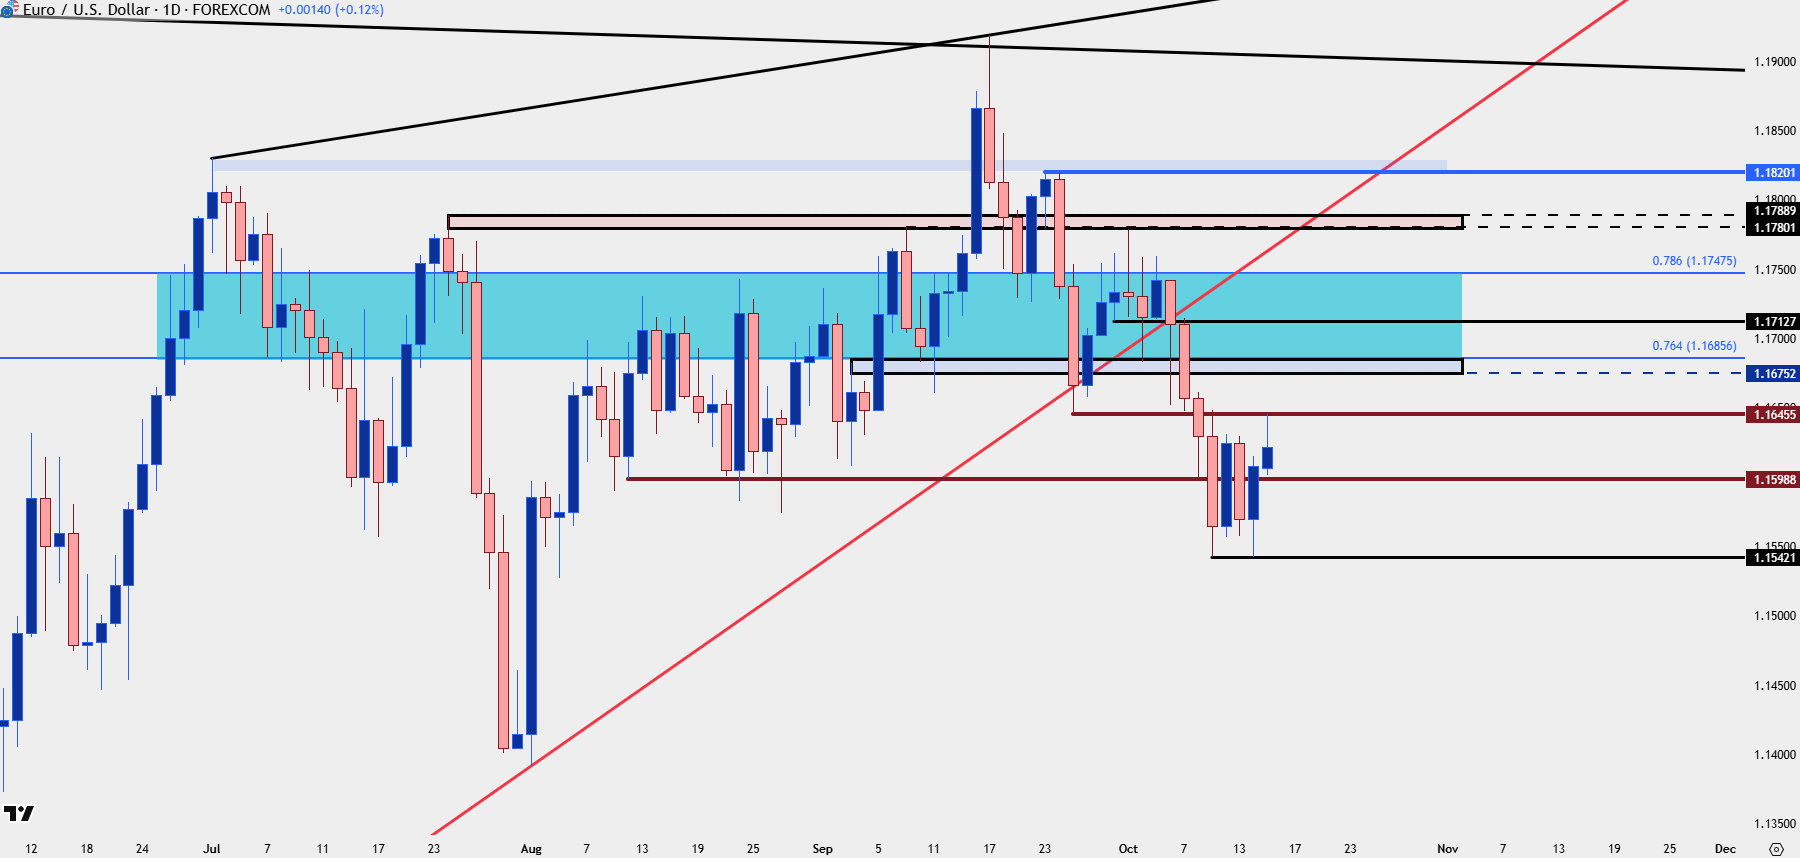
Chart prepared by James Stanley; data derived from Tradingview
--- written by James Stanley, Senior Strategist