


May Forex Seasonality Key Points
- Geopolitical developments in Iran remain the dominant theme for traders, potentially overshadowing May’s FX seasonal trends.
- Historically, May has been the second-weakest month for EUR/USD with an average return of -0.6% over the last 50+ years.
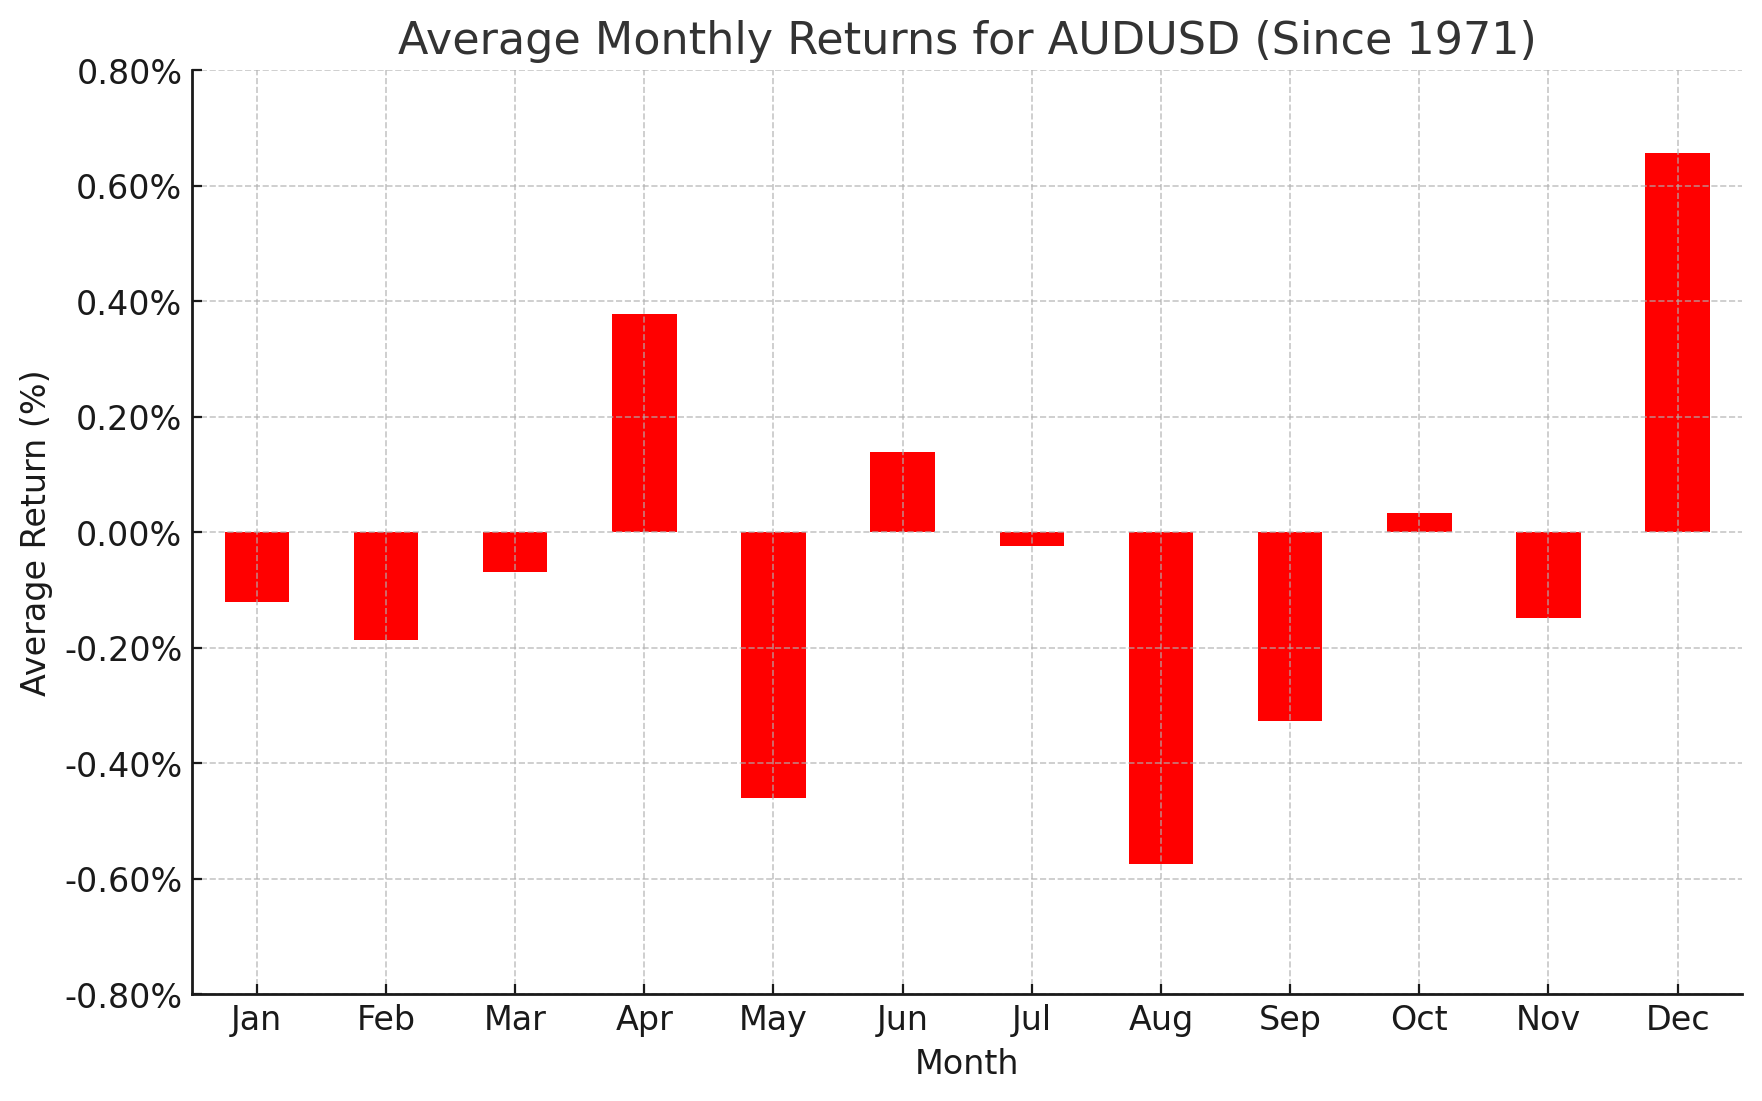
- AUD/USD is trading near 4-year highs, but the pair has historically traded lower in May, with an average loss of -0.5% going back to 1971.
The beginning of a new month marks a good opportunity to review the seasonal patterns that have influenced the forex market over the 50+ years since the Bretton Woods system was dismantled in 1971, ushering in the modern foreign exchange market.
As always, these seasonal tendencies are just historical averages, and any individual month or year may vary from the historic average, so it’s important to complement these seasonal leans with alternative forms of analysis to create a long-term successful trading strategy. In other words, past performance is not necessarily indicative of future results.

Euro Forex Seasonality – EUR/USD Chart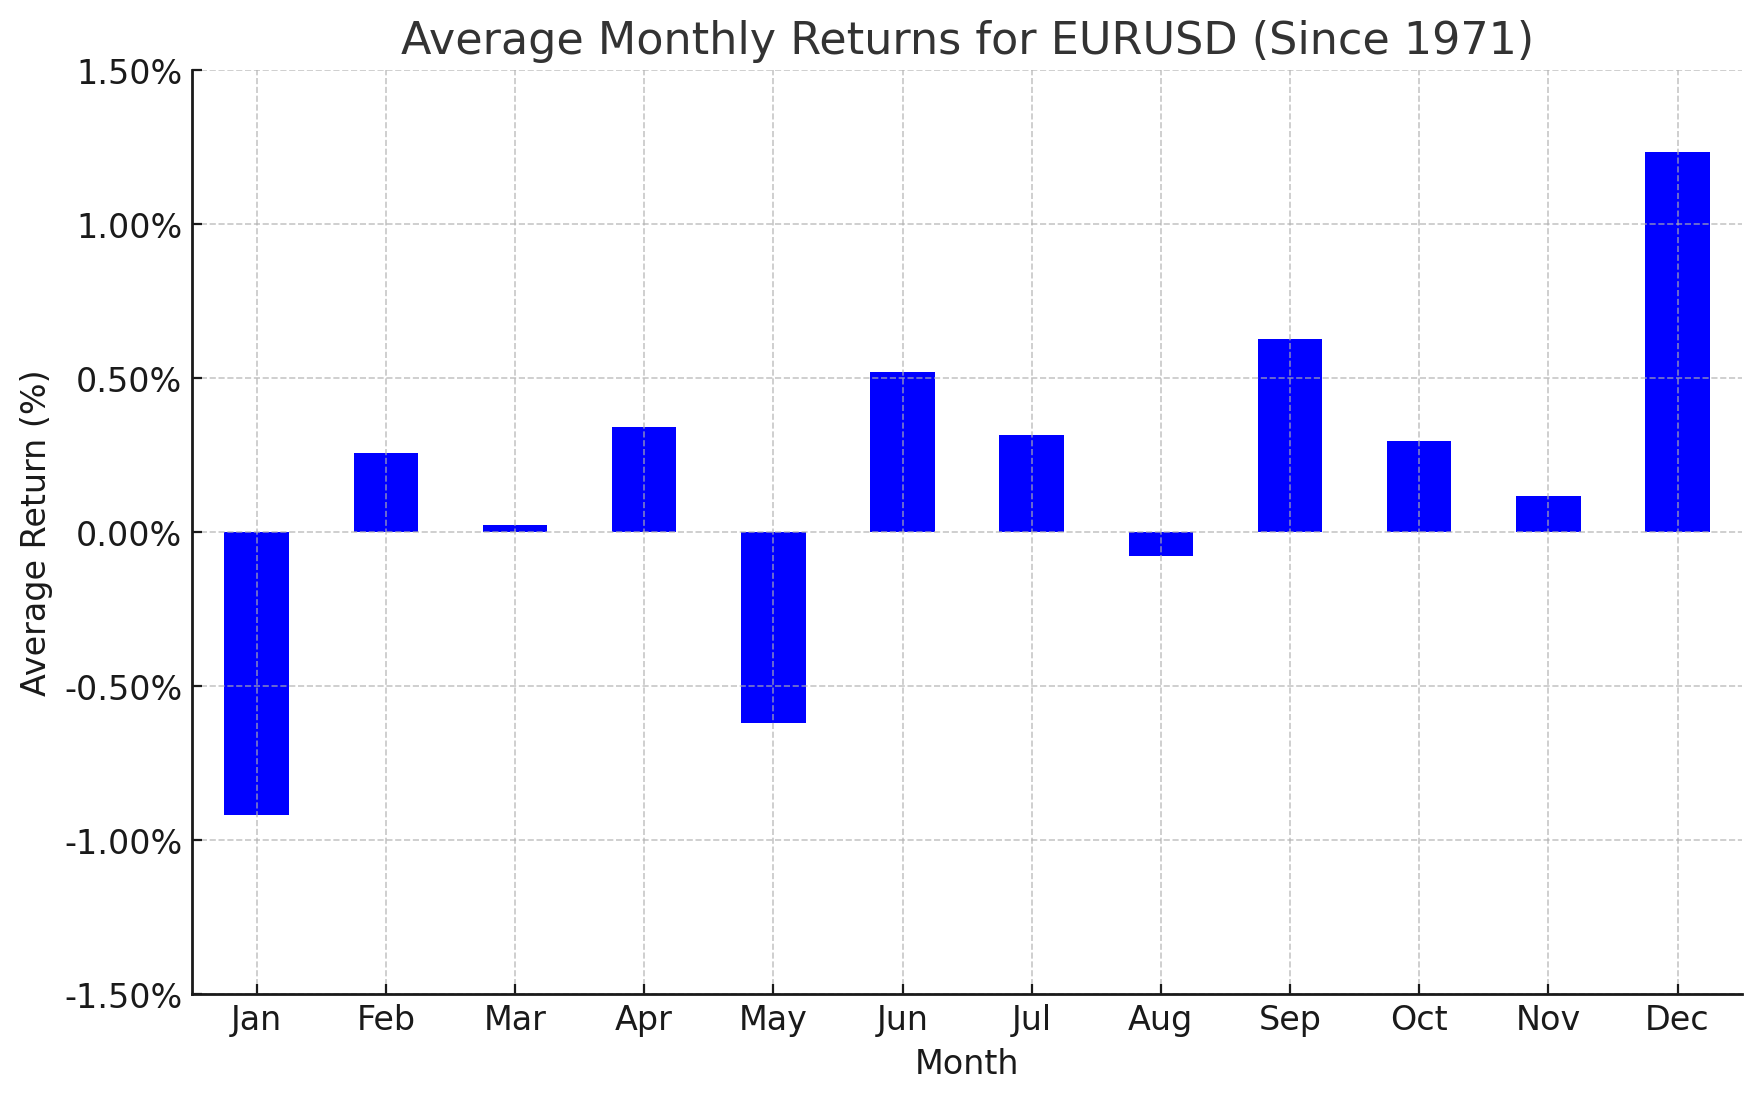
Source: TradingView, StoneX. Please note that past performance is not necessarily indicative of future results.
Historically, May has been the second-weakest month for EUR/USD, with the world’s most widely-traded currency pair sporting an average return of -0.6% over the last 50+ years. In April, EUR/USD rallied 1.5%, matching its seasonal tendency amid broad-based weakness in the US dollar. Looking ahead, continued closure of the Strait of Hormuz is likely to weigh on Europe more than the US economy, so it may require tangible progress toward peace in the Middle East before FX traders are comfortable buying EUR/USD in size.

British Pound Forex Seasonality – GBP/USD Chart
Source: TradingView, StoneX. Please note that past performance is not necessarily indicative of future results.
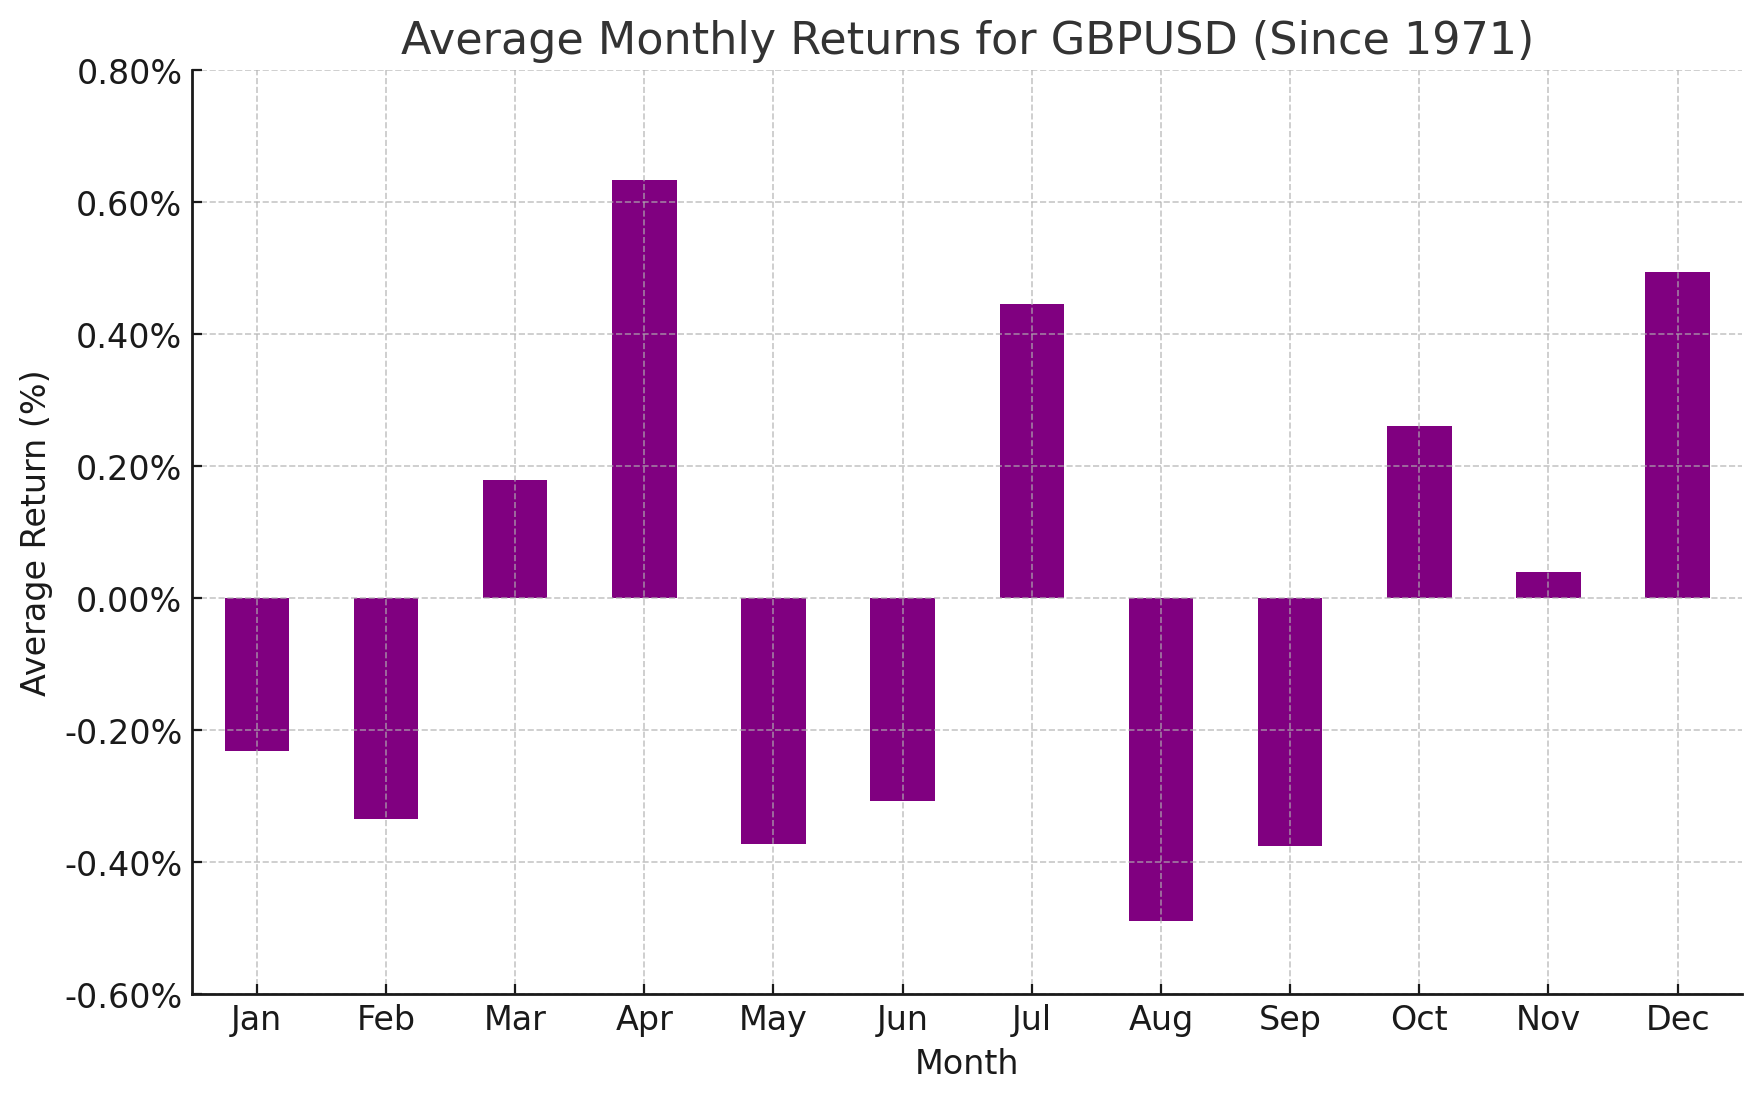
Looking at the above chart, GBP/USD has, on average, seen relatively weak performance in May, with average returns of around -0.4% since 1971. Like the euro, the British pound rallied strongly against the greenback in April to gain nearly +3%, but the combination of geopolitical tensions in the Middle East and weak seasonality could prompt the pair to give back some of its gains in May.

Japanese Yen Forex Seasonality – USD/JPY Chart
Source: TradingView, StoneX. Please note that past performance is not necessarily indicative of future results.
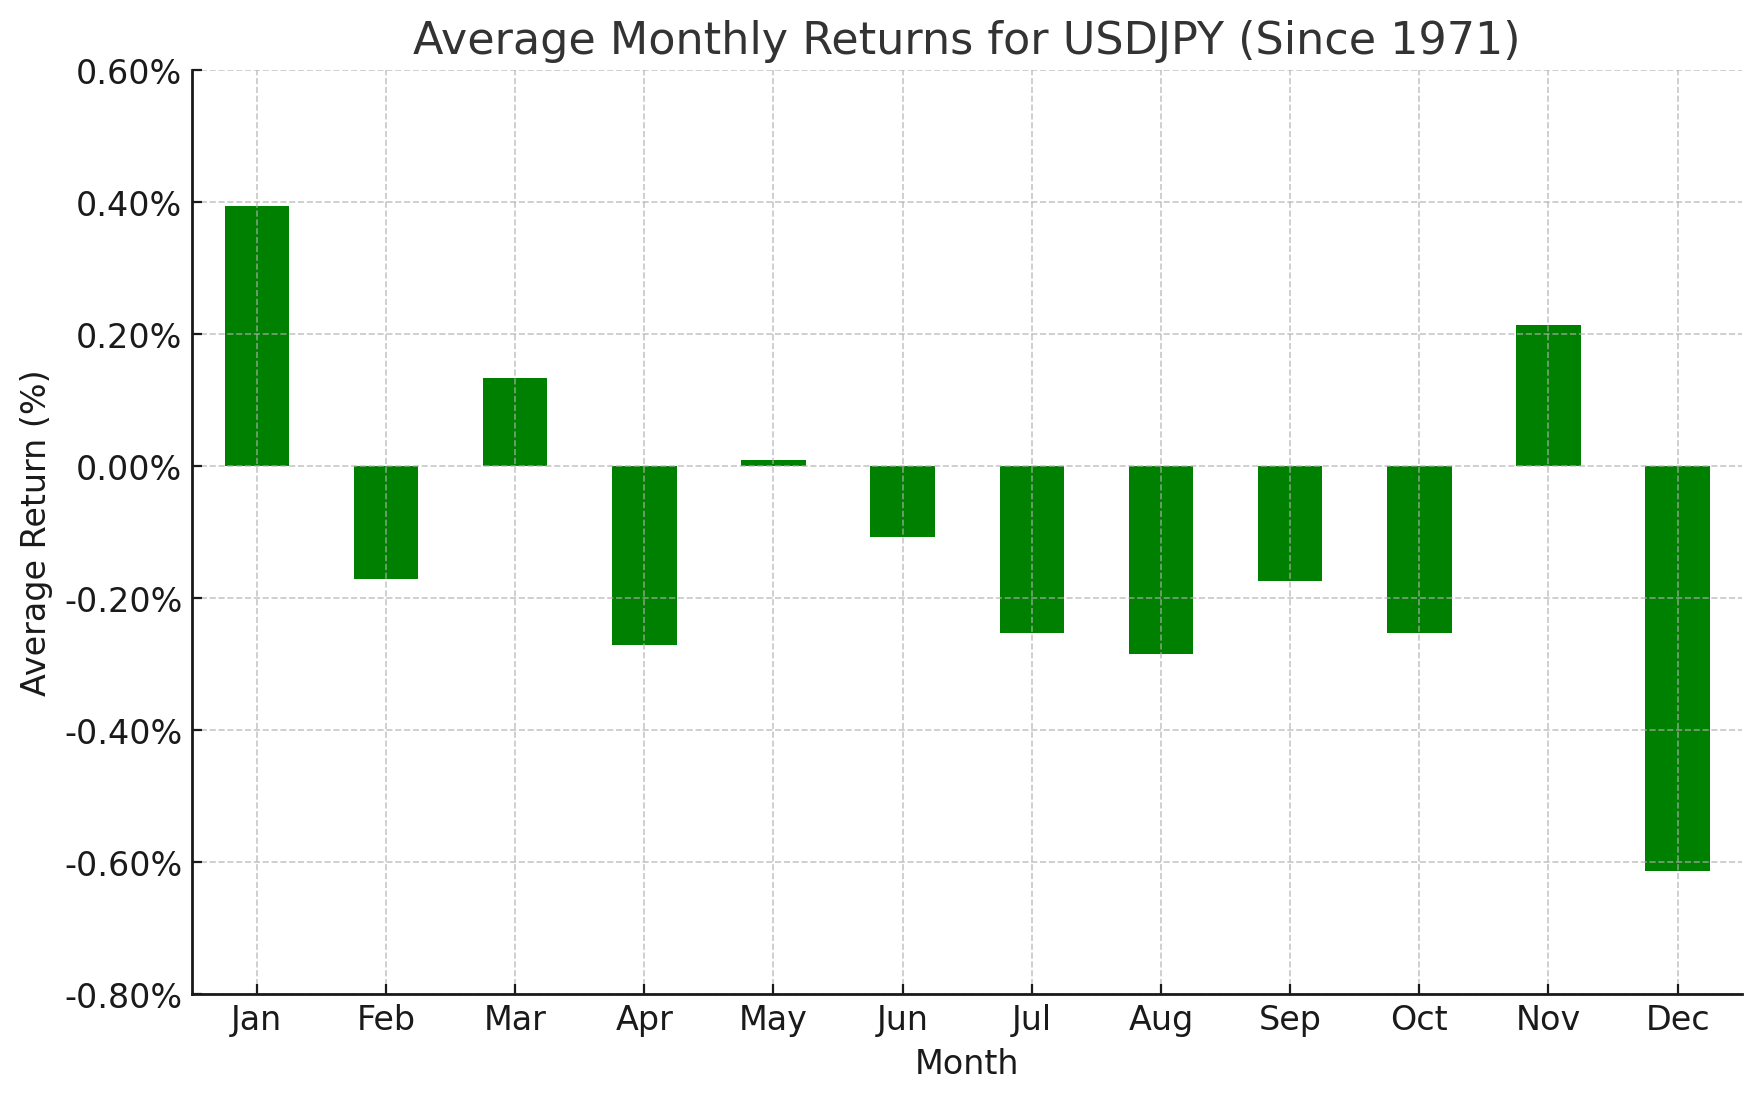
May has historically been a mixed month for USD/JPY, with the pair trading flat on average since the Bretton Woods agreement. USD/JPY fell in line with its monthly tendency last month, and with traders growing increasingly uncomfortable with Japan’s massive sovereign debt load, policy developments from the island nation (including the BOJ and Finance Ministry’s ongoing intervention into the yen) may decrease the immediate impact of the Middle East conflict as a catalyst. Ultimately, Japanese policymakers are weighing defending either longer-term bond yields and the value of the currency, with potentially big implications for all yen crosses moving forward.

Australian Dollar Forex Seasonality – AUD/USD Chart
Source: TradingView, StoneX. Please note that past performance is not necessarily indicative of future results.
Turning our attention Down Under, AUD/USD has historically traded lower in May, with an average loss of -0.5% going back to 1971. Last month, the Aussie rallied in-line with the broader weakness in the US dollar, taking the pair to its highest level in four years as we go to press. Previous-resistance-turned-support at the 0.7200 level will be the key “line in the sand” for this month, with bears hesitant to push the pair lower unless or until the exchange rate drops conclusively back below it.
Canadian Dollar Forex Seasonality – USD/CAD Chart
Source: TradingView, StoneX. Please note that past performance is not necessarily indicative of future results.
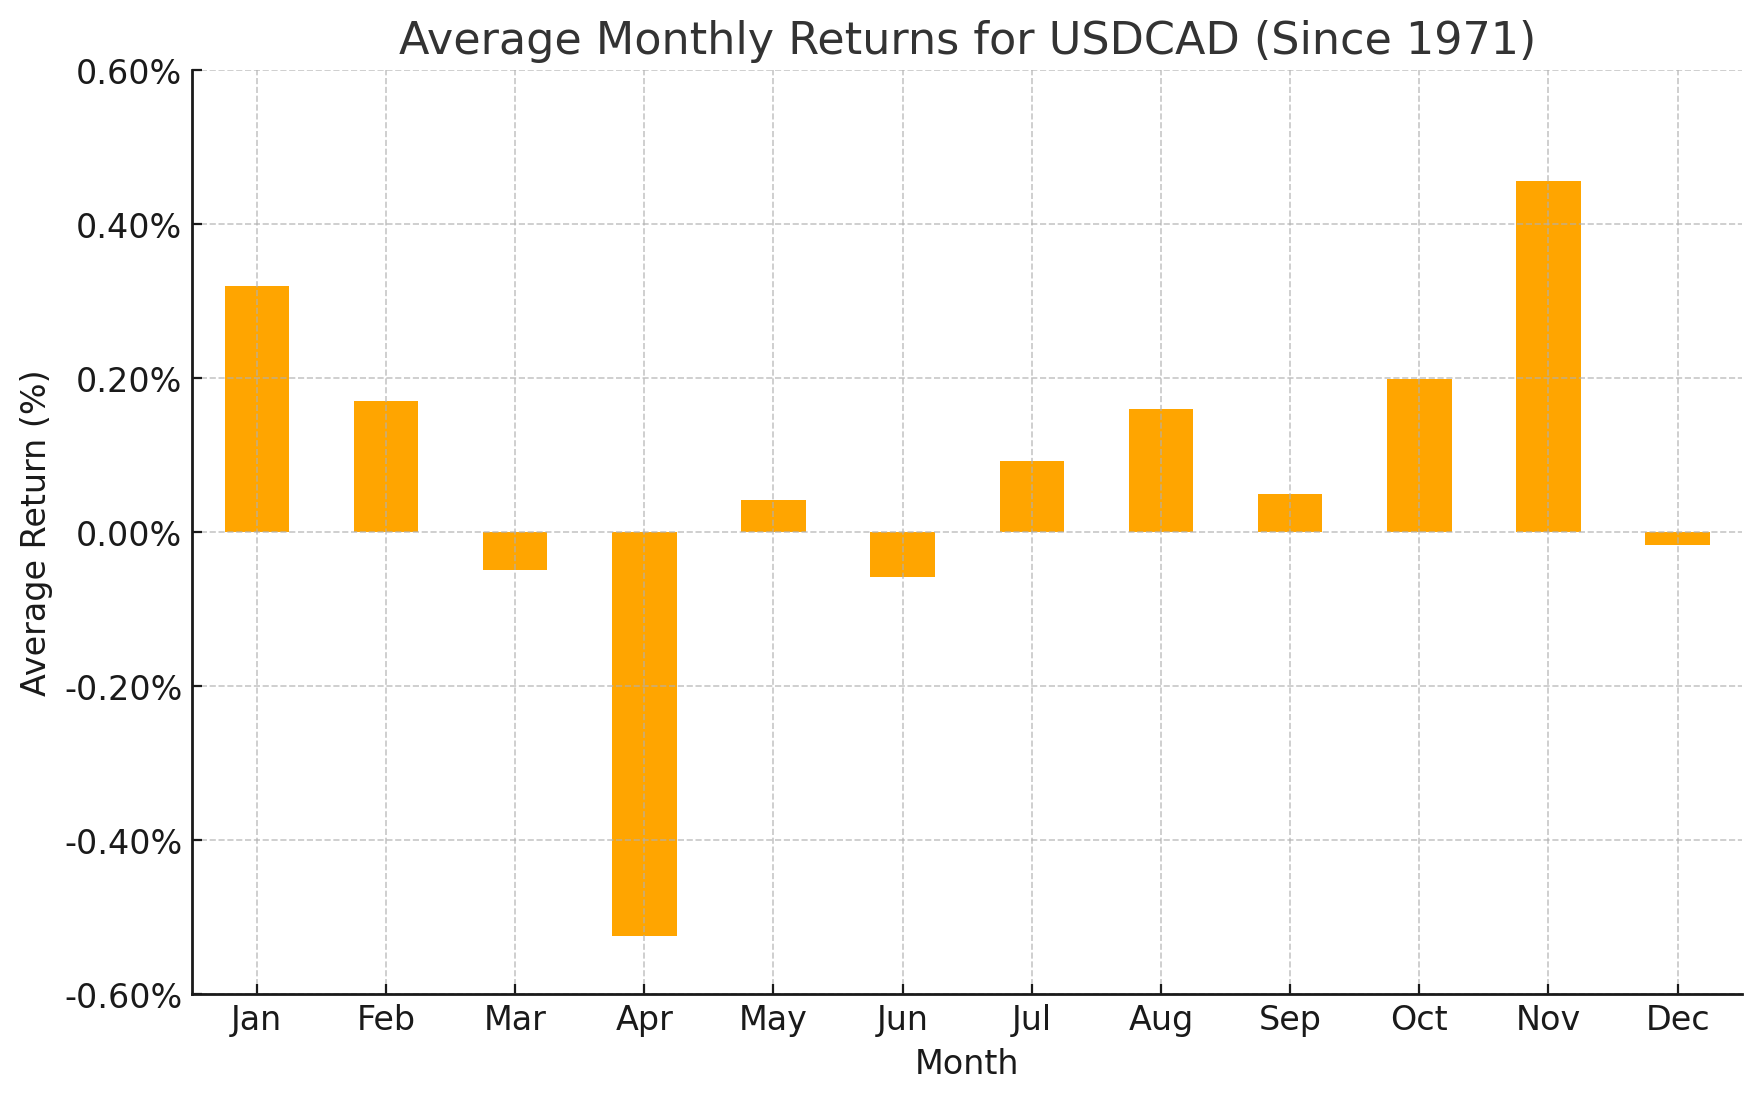
Last but not least, May has been a neutral month on average for USD/CAD, with an average historical return of +0.0%. The North American pair fell sharply in April (historically its weakest month) to test its 18-month low in the 1.3500 area once again. Beyond developments in Iran and the subsequent impact on energy prices, the occasionally-frosty relationship between the US and Canadian administrations will take on increased significance in the coming months ahead of the potential renewal of the USMCA trade deal on July 1.
As always, we want to close this article by reminding readers that seasonal tendencies are not gospel – even if they’ve tracked relatively closely so far this year – so it’s important to complement this analysis with an examination of the current fundamental and technical backdrops for the major currency pairs.
-- Written by Matt Weller, Global Head of Research
Check out Matt’s Daily Market Update videos on YouTube and be sure to follow Matt on Twitter: @MWellerFX






