


Key scenarios to watch on the GBP/USD and DJIA charts amid rate-hike risks and a potentially hawkish FOMC decision tonight. These factors are supporting risk-off sentiment alongside strong trends across energy markets and U.S. Treasury yields.
Key developments in focus include:
- The DXY is still holding its ground above the 98.50 support level, limiting gains across currency markets. USD/JPY, DXY Outlook: Short-Term Weakness, Long-Term Strength?
- GBP/USD gains were capped below the 1.3680 resistance level and the upper boundary of the yearly contracting consolidation, signallng a short-term bearish bias.
- The Dow Jones is still holding below the boundaries of its April–September 2026 uptrend, also signaling a short-term bearish bias.
- The probability of a 25 bps rate hike tonight is above 90% (CME Fed Watch Tool)
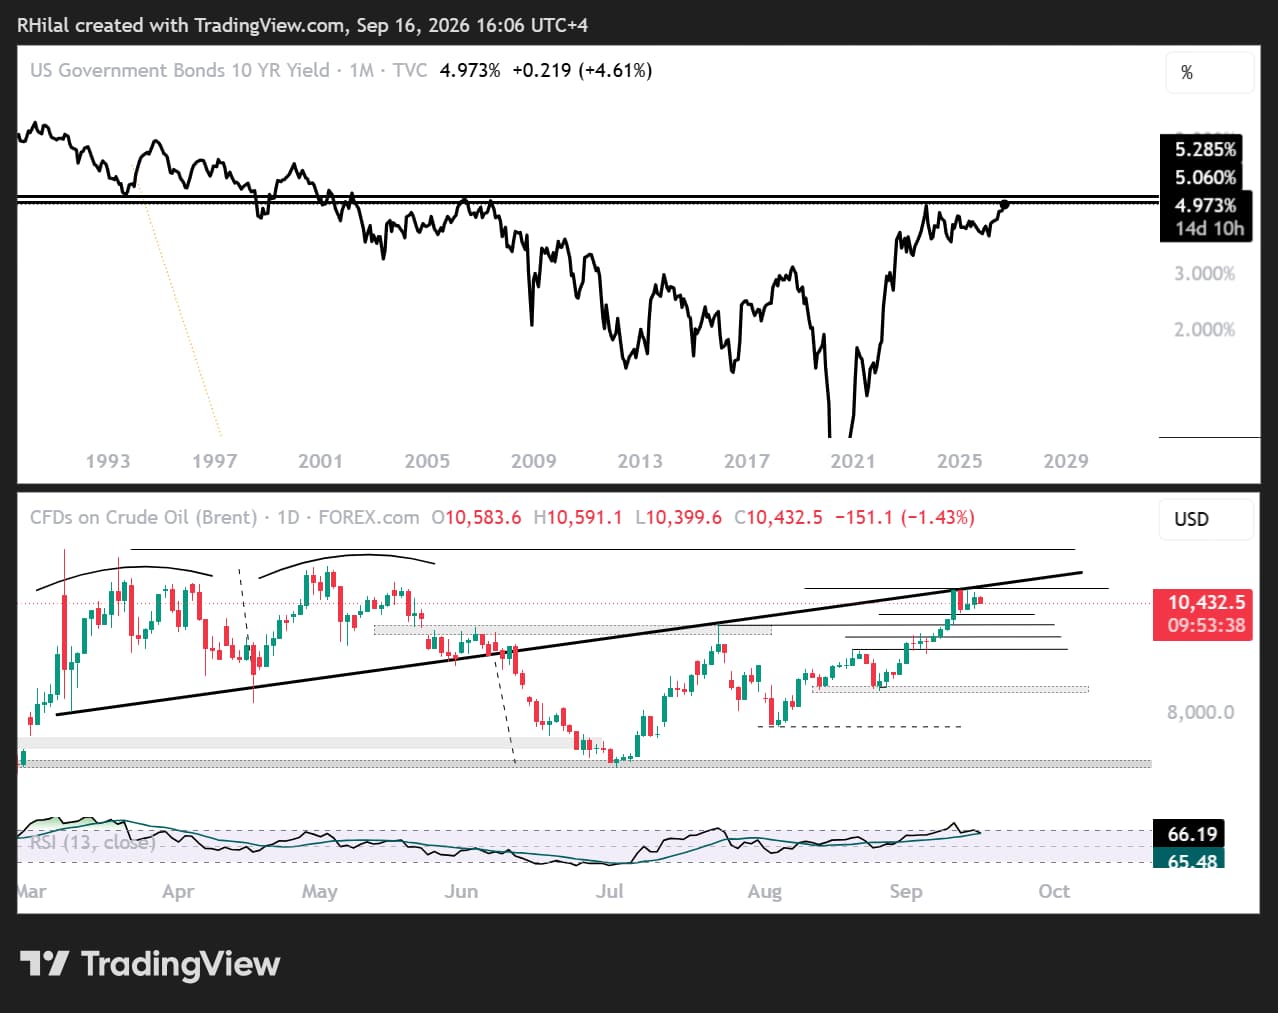
Before reviewing the key scenarios for the pound and the Dow, it is worth noting the stretched price action in the U.S. 10-year Treasury yield, which is testing highs last seen in 2007 while daily momentum reaches overbought levels last seen in 2023.
At the same time, the UKOIL chart is testing yearly momentum highs, with overbought risks increasing as price action approaches a critical resistance and 7-month confluence zone.
US10Y Yield and UKOIL — Log Scale
Source: TradingView
These charts are being monitored ahead of the FOMC to assess the potential pullback risk across the broader escalation narrative.
Should both charts continue higher, particularly if UKOIL breaks above 108, risk-off pressure may persist across markets.
I analyze these set ups in more detail in my weekly webinars
Register here for the next webinar
Now back to the GBPUSD and Dow
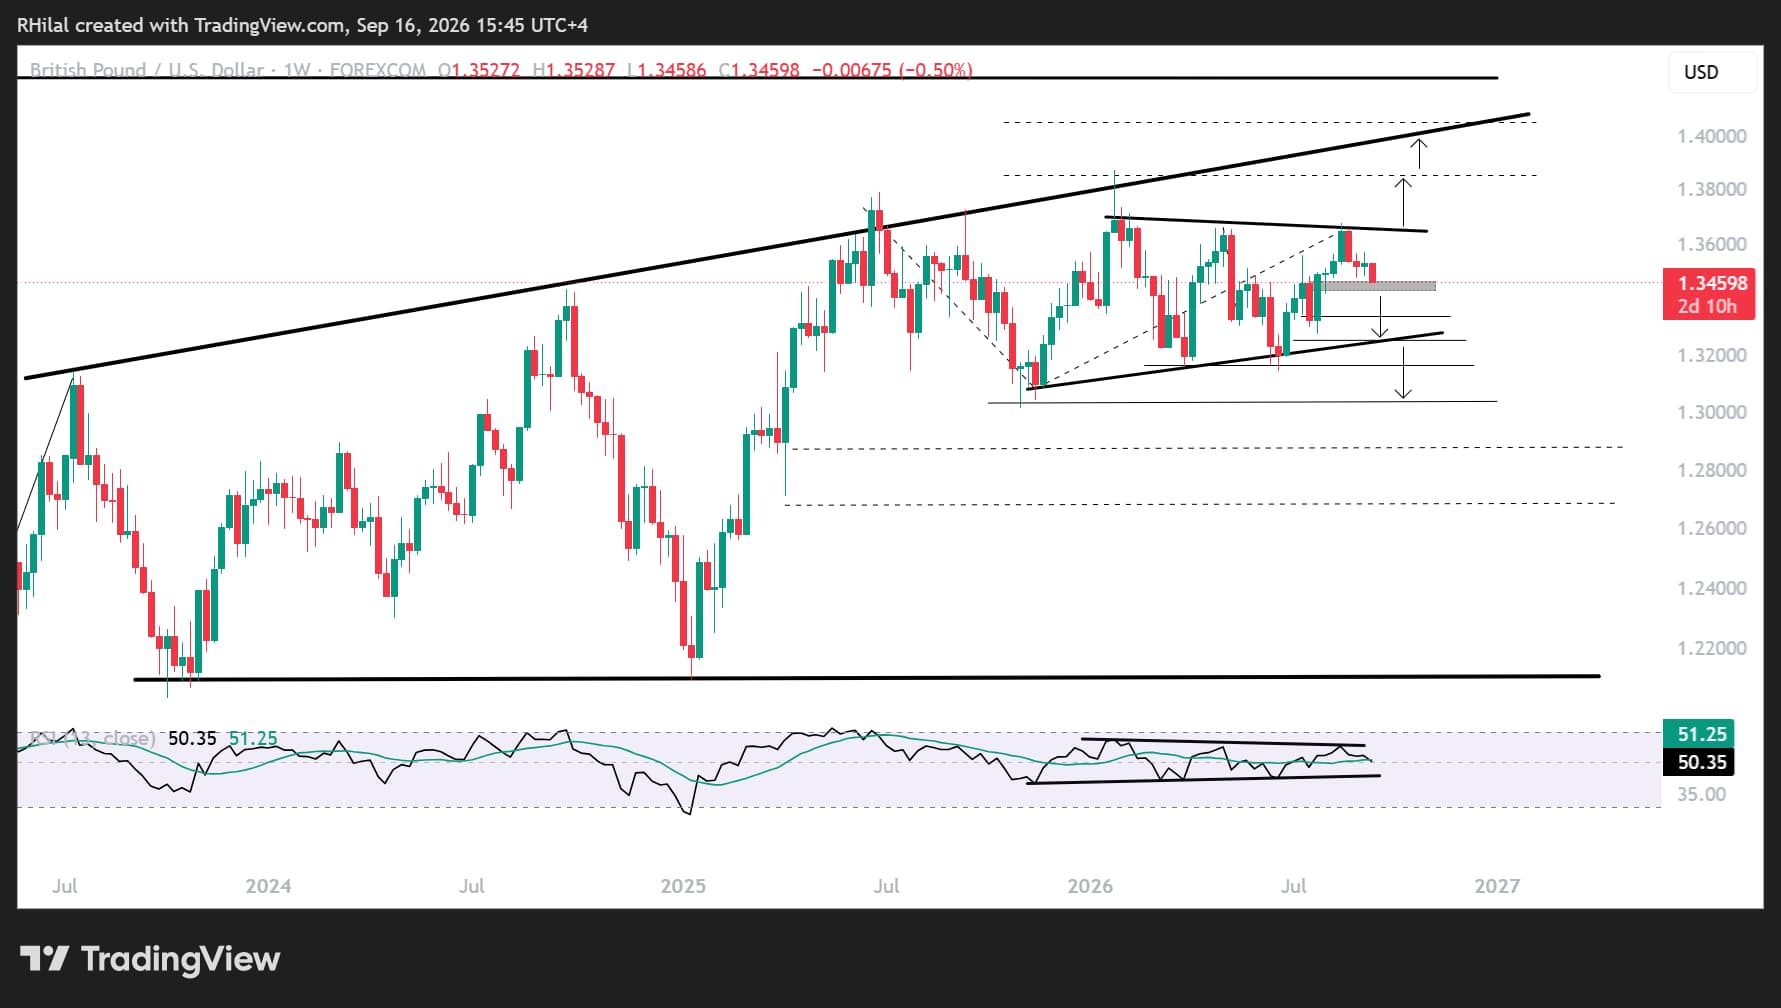
GBP/USD Forecast: Weekly Time Frame — Log Scale
Source: TradingView
Throughout the year, the GBP/USD pair has traded within the boundaries of a contracting consolidation below the 1.38–1.3680 resistance zone.
The latest rebound in the DXY above the 98.50 support level coincided with another pullback in GBP/USD from the upper boundary of the consolidation, reinforcing the short-term bearish outlook.
A breakdown below the 1.3430 support level would accelerate the decline toward the lower boundary of the consolidation near 1.3340 and 1.3240.
These levels are defined using the Fibonacci extensions of the wave spanning July 2025, November 2025 and July 2026.
On the upside, a breakout above 1.3580 and 1.3680 would be required to confirm bullish continuation toward the 1.40 zone.
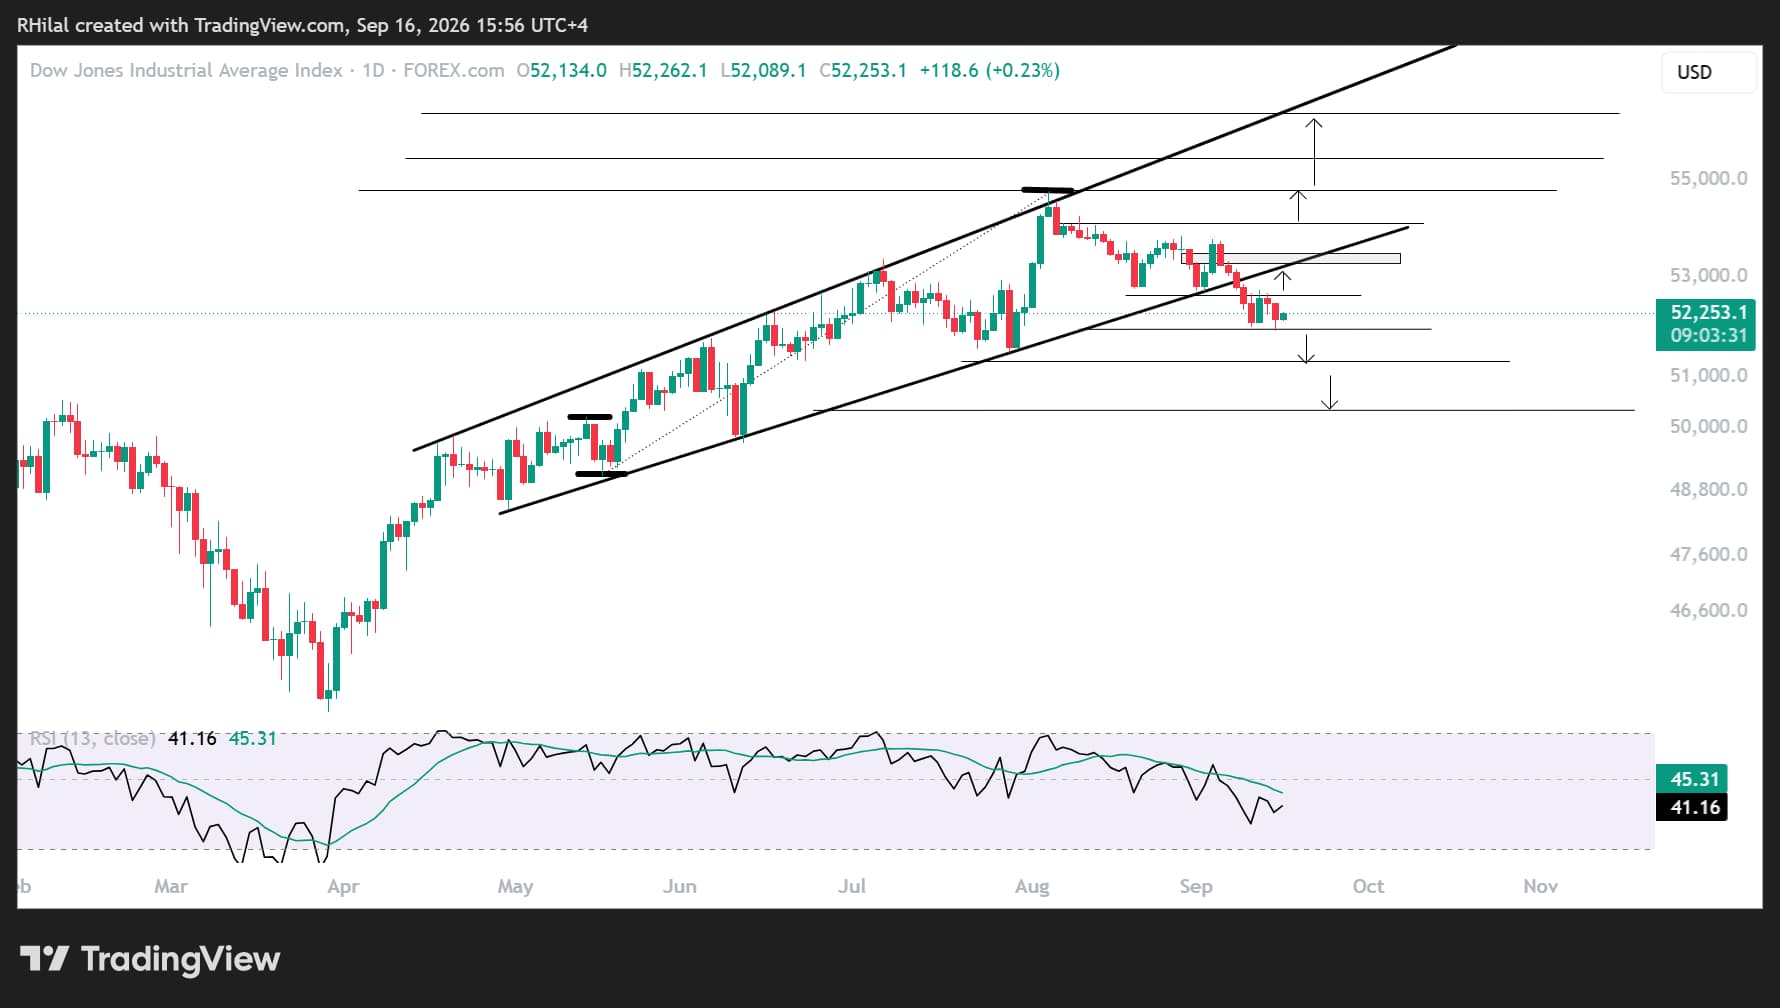
DJIA Forecast: Daily Time Frame — Log Scale
Source: TradingView
From a daily perspective, the Dow Jones is still holding below the uptrend support line that has been in place since the April 2026 lows.
The index is also holding above the 50% Fibonacci retracement of the May–August advance near 51,900.
Bearish scenario: A breakdown below 51,900 would target the 61.8% and 78.6% Fibonacci retracement levels near 51,200 and 50,300, respectively.
A sustained move below these levels would increase the risk of a broader bearish outlook for the year.
Bullish scenario: Reclaiming 52,600 and 52,400 would support the continuation of the bullish bias toward 54,000 and the yearly highs near 54,800. these levels are defined via the Fibonacci extension tool of the May-August-September wave.
A move above that level would reinforce the uptrend and expose the trendline connecting the higher highs since April 2026, near 57,000.
The Fed’s tone and crude oil’s price direction will likely play a key role in shaping the next potential market trends.
Written by Razan Hilal, CMT
Follow on X: @Rh_waves






