
GBP/USD has now recorded three consecutive bearish sessions in the short term, resulting in a decline of more than 1%, reflecting a renewed and consistent selling bias in recent price action.
Selling pressure intensified following the release of UK inflation (CPI) data, which point toward a potentially more flexible stance from the Bank of England in the coming months. This scenario has weakened the pound in the short term and, if sustained, could continue to fuel further downside pressure in GBP/USD in upcoming sessions.

First Inflation Data of the Year
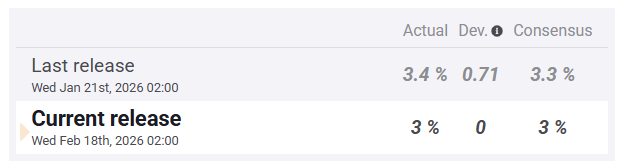
Earlier today, the UK’s year-over-year (YoY) CPI data were released. The official figure came in at 3.00%, in line with market expectations for January and below the previous reading of 3.4% recorded in December 2025.
Source: FxStreet
The key takeaway from this release is that it confirms a sustained deceleration in UK inflation. The current 3.00% reading remains well below the highs near 3.8% seen in mid-2025 and is gradually moving closer to the Bank of England’s 2.00% target.
This suggests that the inflationary pressures that previously concerned policymakers have begun to moderate meaningfully, maintaining a downward trend in recent months.

Source: TradingEconomics
In this context, the probability of a rate cut by the Bank of England at its upcoming March meeting has become more relevant. Markets are currently assigning a probability above 50% to a potential rate reduction, which would imply a move from the current 3.75% level toward 3.50%.
In the past, the Bank of England had followed a rate-cutting trajectory that was paused due to inflation uncertainty. However, with the recent moderation in consumer prices, inflationary risks have eased, potentially opening the door for a more accommodative monetary policy stance in upcoming decisions.
This scenario is particularly relevant for the pound, as a rate cut would imply lower yields on UK bonds. That could reduce the attractiveness of pound-denominated assets, limit foreign capital inflows, and weaken demand for the currency in the short term, thereby reinforcing selling pressure in GBP/USD.
How Is the U.S. Federal Reserve Positioned?
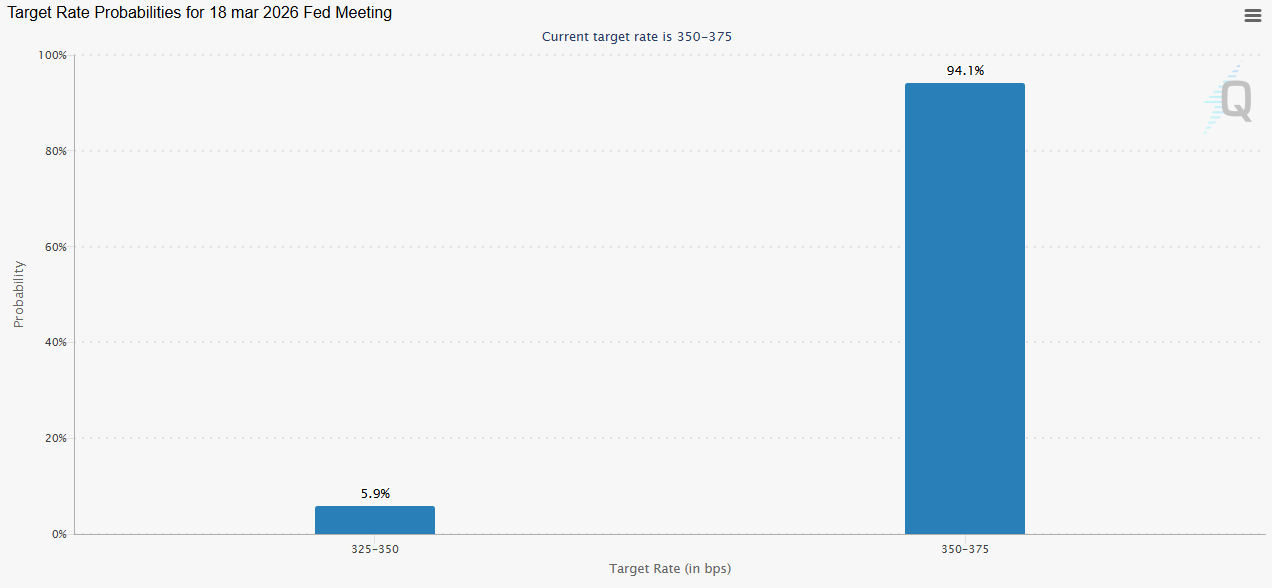
It is important to note that, similar to the UK, the benchmark interest rate in the United States remains at 3.75%. However, unlike the Bank of England, the outlook for the Federal Reserve at its March 18 meeting shows a 94.1% probability of rates remaining unchanged, according to CME Group data.
Source: CMEGROUP
This divergence is significant. If the Bank of England proceeds with a rate cut while the Federal Reserve keeps rates steady, the interest rate differential could widen in favor of the U.S. dollar. That would increase the relative attractiveness of dollar-denominated assets compared to those in pounds, potentially supporting further dollar demand and maintaining selling pressure on GBP/USD in the coming sessions.
GBP/USD Technical Outlook
Source: StoneX, Tradingview
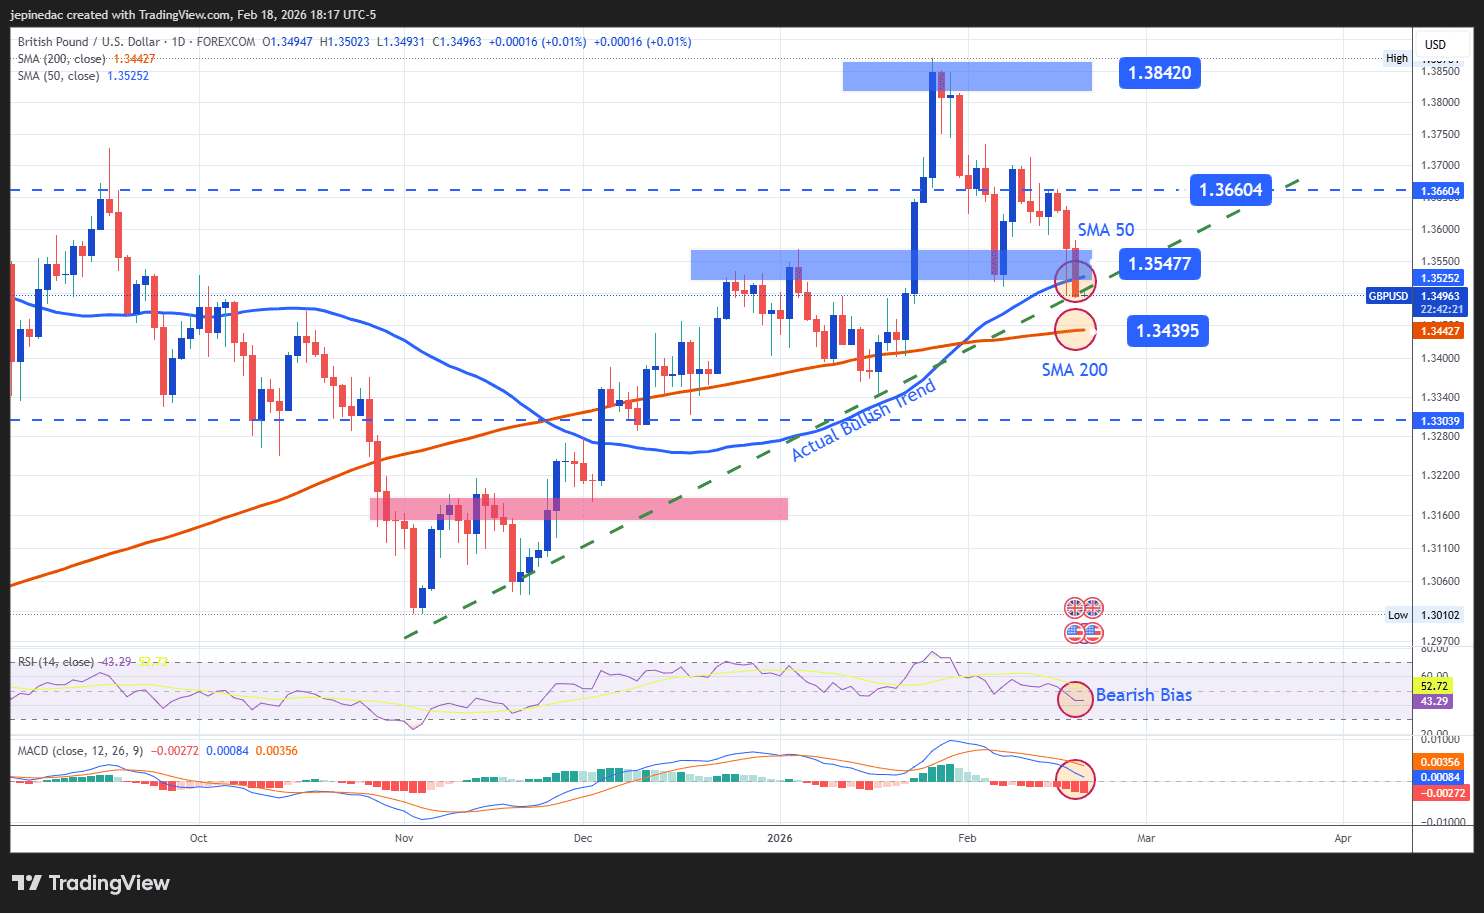
- Uptrend at Risk: Recent bearish movements are increasingly approaching the upward trendline that has been in place since November 2025. If selling pressure consolidates and breaks below this structure, it could trigger a more consistent directional move to the downside in the short term and diminish the relevance of the uptrend that dominated in previous months.
- RSI: The RSI remains below the neutral 50 level, indicating that selling momentum has begun to dominate over the past 14 sessions. This behavior supports the possibility that bearish pressure may continue to be relevant in the near term.
- MACD: The MACD histogram remains below the zero line, suggesting that short-term moving average momentum continues to favor sellers. If the histogram continues to decline, it could reinforce downside pressure in the coming sessions.
Key Levels:
- 1.36604 – Key resistance: A level aligned with recent highs and representing the primary upside barrier. A sustained move back toward this zone could reactivate buying interest and allow for an extension of the prevailing uptrend.
- 1.35477 – Near-term barrier: A recent neutrality zone aligned with the 50-period moving average. Price action within this region could maintain a short-term consolidation scenario.
- 1.34395 – Major support: A key level aligned with the 200-period moving average and representing the most relevant downside barrier. A sustained break below this zone would imply a structural shift and could solidify a more consistent bearish bias.
Written by Julian Pineda, CFA, CMT – Market Analyst
Follow him on: @julianpineda25