
The trading week is coming to an end, and a sense of neutrality remains evident around gold's short-term price action. Over the last five trading sessions, the metal has posted a move of barely -0.3%, a situation that continues to highlight a growing phase of indecision and reflects a clear lack of direction across the market.
What makes this dynamic particularly interesting is that it has persisted even as competing markets such as U.S. Treasuries have begun to lose some of their appeal in recent sessions. In other words, gold has failed to benefit from an environment that under different circumstances could have supported a stronger recovery in demand. As long as this situation remains in place, neutrality could continue to dominate XAU/USD price action in the sessions ahead.

Is a Lack of Activity Beginning to Dominate the Gold Market?
The week was marked by important shifts in expectations surrounding U.S. monetary policy. Initially, inflation data showed annual CPI at 3.7%, above the market expectation of 3.6%, temporarily reinforcing the view that inflation remains a meaningful challenge for the Federal Reserve.
However, that effect faded shortly afterward. Comments from Federal Reserve officials helped moderate expectations of an immediate rate hike in October and shifted attention back toward a scenario in which monetary policy remains unchanged in the near term. Current market probabilities continue to reflect roughly an 82% chance of no rate changes at the October 28 meeting, reinforcing expectations of relative policy stability in the short term.
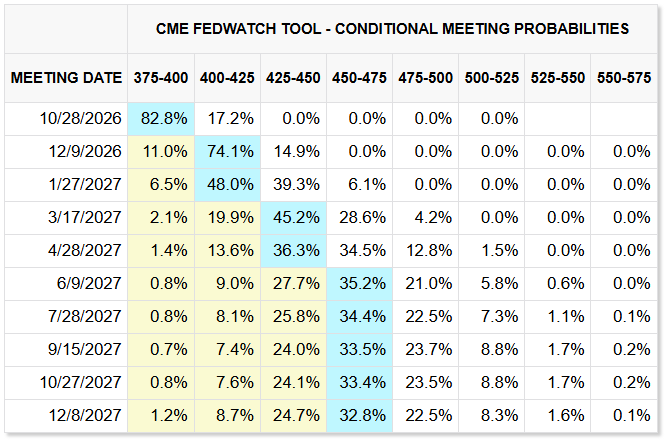
Source: CMEGROUP
This dynamic has also had an impact on the bond market, one of gold's main competitors over recent months. Following the comments from Federal Reserve officials, 10-year U.S. Treasury yields began to moderate again and have retreated toward the 5.0% area, moving away from recent highs and reflecting a decline in the relative attractiveness of this market.
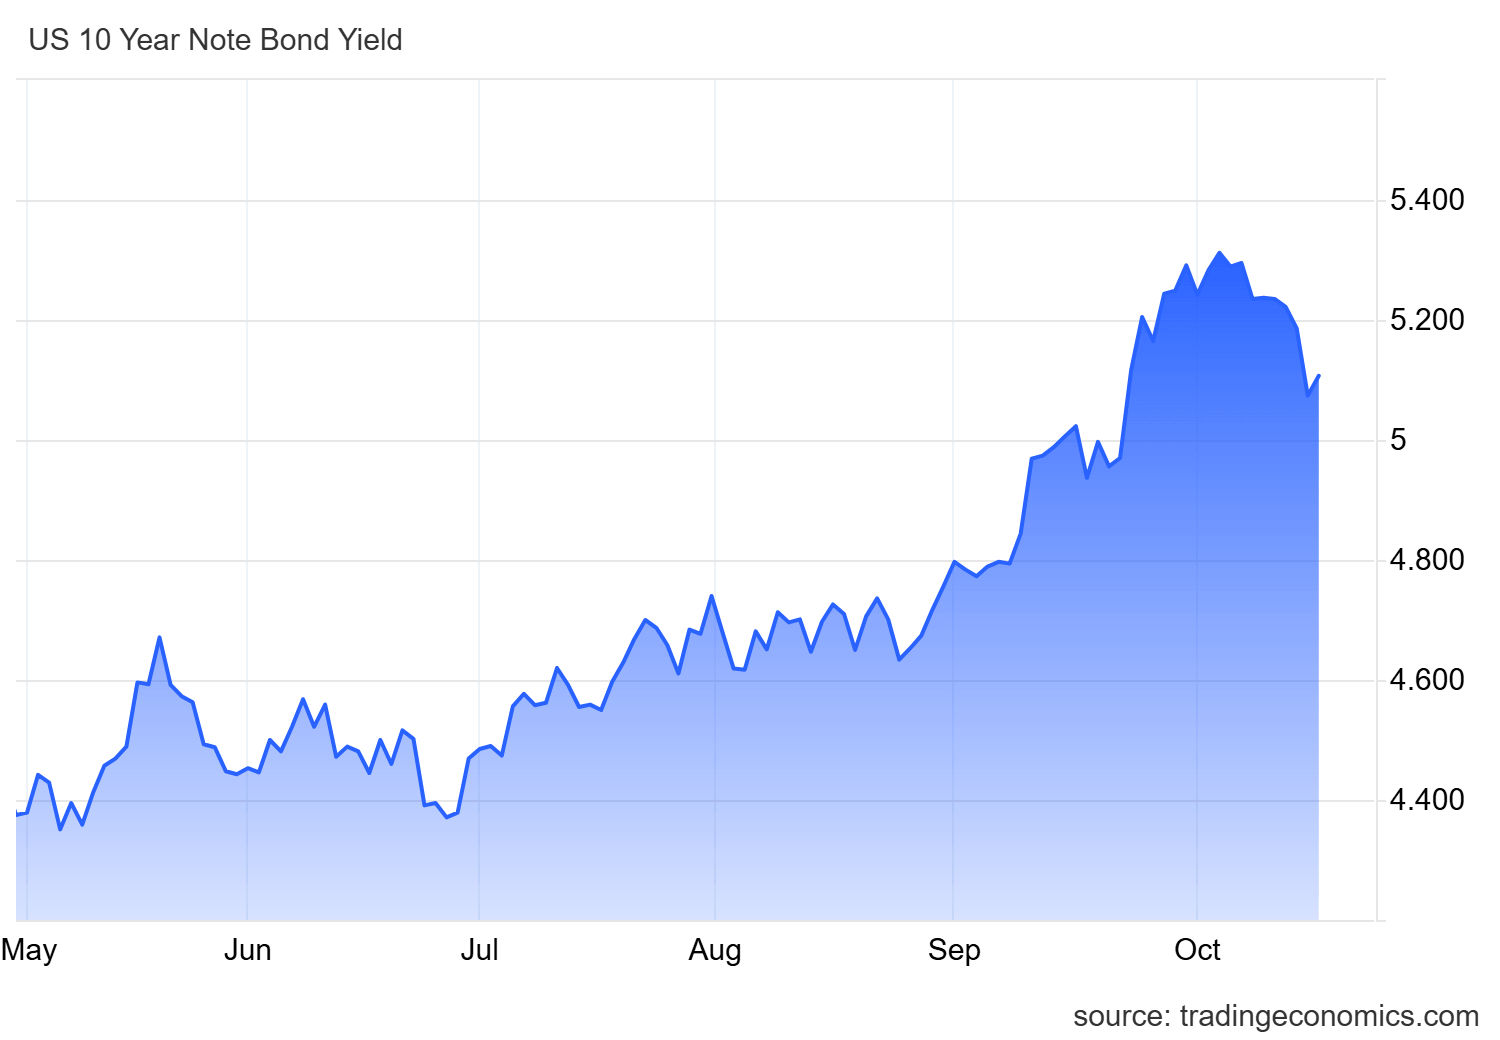
Source: TradingEconomics
Under normal circumstances, a loss of attractiveness in the bond market would tend to support a recovery in demand for gold given the competitive relationship between both assets. This time, however, the reaction has been different.
Despite the recent moderation in Treasury yields, demand for gold remains limited. This can be observed through the flows of the SPDR Gold Trust (GLD) ETF, where no particularly significant capital inflows have been seen in recent sessions. In fact, the latest reading from October 15 showed net outflows of approximately $37 million.
This remains important because it suggests that institutional interest in the precious metal continues to be relatively weak. In other words, even as one of gold's main competitors loses some of its appeal, demand for gold continues to reflect a cautious tone in the short term.
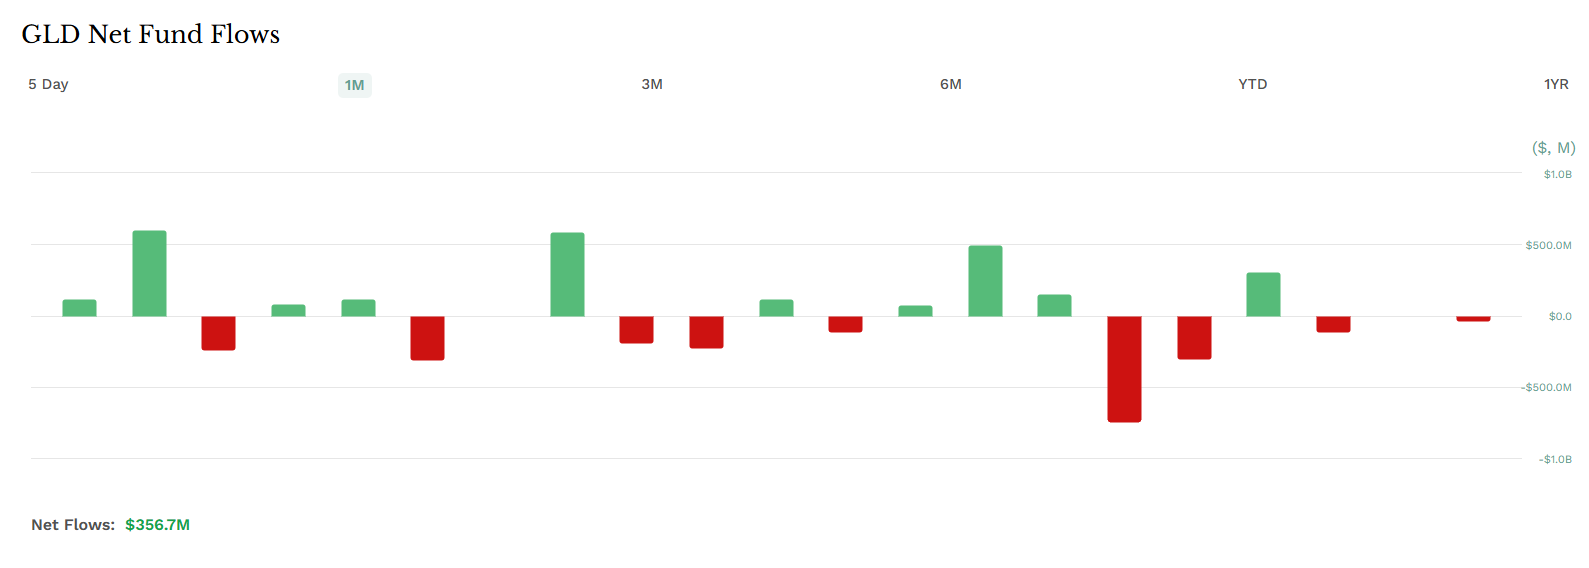
Source: ETF
Taken together, these developments suggest that gold is moving through a particularly challenging period. The market has failed to respond positively to the weakness observed in Treasury yields, indicating that part of the capital flow may be moving toward other alternatives within financial markets. As a result, gold is beginning to lag behind in terms of both activity and demand.
As long as this lack of interest remains evident, the current phase of indecision could continue to dominate market behavior. Moreover, if Treasury yields begin to strengthen again in the coming weeks, the outlook could even shift toward a more pronounced bearish environment for gold.
Gold Technical Forecast
Source: StoneX, Tradingview
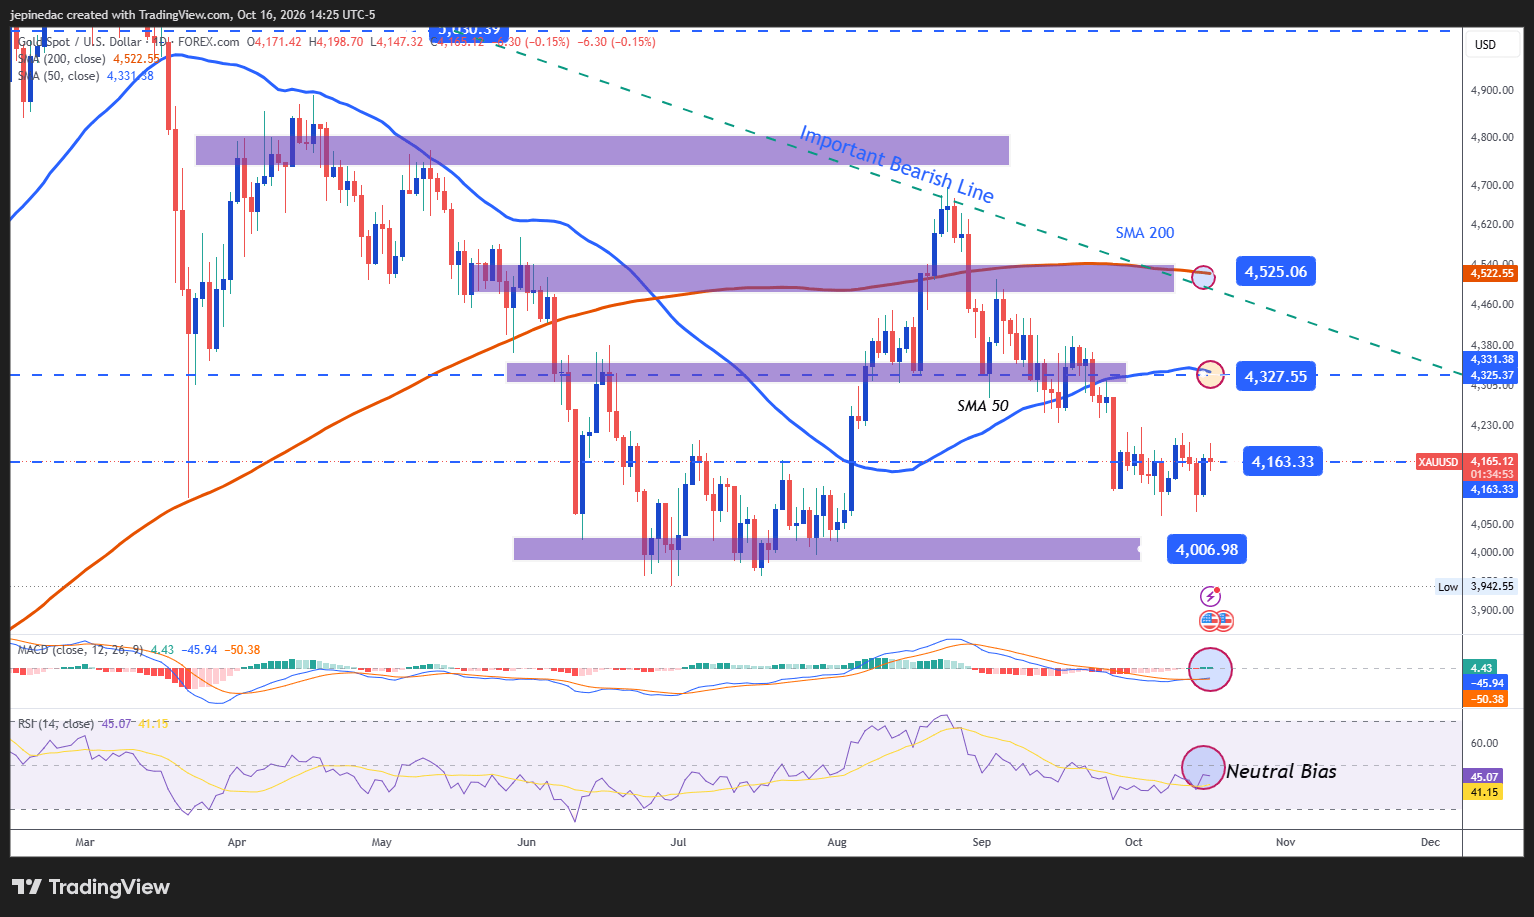
- The bearish trendline remains the dominant technical structure: Gold continues to develop under the influence of an important short-term bearish trendline that remains the primary technical reference on the chart. However, recent sessions have also highlighted a growing phase of neutrality that reflects fading momentum within the current trend. If this lack of direction persists, a more established trading range could begin to gain relevance in the short term.
- RSI: The RSI continues to trade near its neutral zone, reflecting a relatively balanced relationship between buyers and sellers. This reading supports the idea that a phase of indecision could remain relevant in the sessions ahead.
- MACD: A similar picture can be seen in the MACD, whose histogram continues to fluctuate around the 0 neutral line. This suggests that short-term moving averages are not displaying a dominant direction and continues to support a low-momentum environment across the market.
Key Levels to Watch:
- $4,320 – Key Resistance: An important upside barrier that aligns with the most significant highs on the chart and develops near the 50-period simple moving average. Price action that manages to consolidate above this area could place the dominant bearish structure at risk and open the door to a more constructive bullish bias over the coming weeks.
- $4,160 – Near-Term Barrier: An important equilibrium zone observed in recent weeks that currently acts as the main area of neutrality on the chart. If price remains near this level, a lack of direction could continue to dominate and support the development of a more structured trading range.
- $4,000 – Critical Support: An important support area that also coincides with a major psychological level for the market. Moves back toward this zone could restore relevance to selling pressure, bring an end to the current neutral phase, and reinforce the broader bearish trend as the dominant technical structure in the weeks ahead.
Written by Julian Pineda, CFA, CMT – Market Analyst
Follow him on: @julianpineda25