



It was an ‘up the stairs, down the elevator’ move in gold in late January as the metal basically gave up an entire month’s gain in a violent three-day sell-off. It was quick but sentiment in the headlines seemingly turned bearish and skeptical but the reality is price held former structure fairly well, as it was the swing-low at 4407 – which held the higher low on January 8th, which caught the low point of that pullback before buyers jumped back on the bid.
Near immediately there was a snap back rally up to the 5100 level, and this was a spot of prior support that held another resistance test a week later. But – notably – that second test led to a higher-low, and it was that support at 4856, which I had worked with in the Tuesday webinar two weeks ago, that led to a third test of the 5100 resistance zone.
That set up a textbook ascending triangle formation that resolved in a textbook manner with the breakout to begin last week.
That breakout ran directly up to the next zone of resistance from prior support, and that’s what’s so far held the highs as we work into the weekly close.
Gold Four-Hour Chart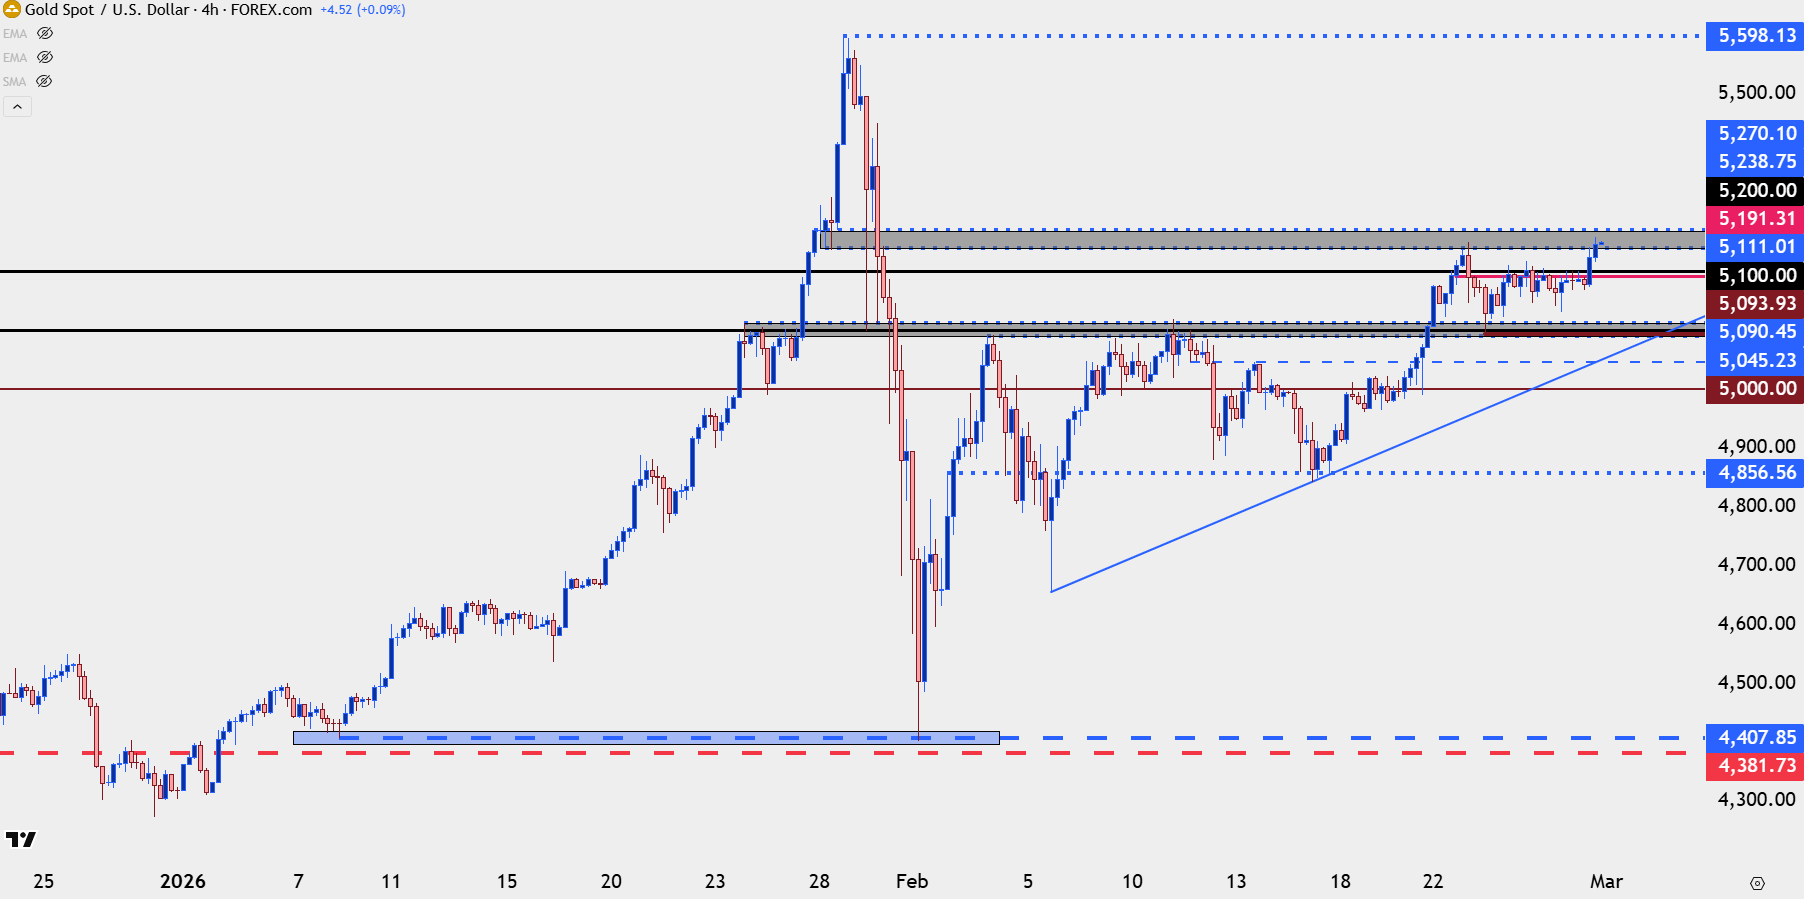
Chart prepared by James Stanley; data derived from Tradingview
Gold Weekly
From the weekly chart it looks like the broader trend in the metal is ready for resumption which could soon lead to a challenge at that prior ATH with both 5500 and 5600 setting up well for future tests.
The wide upper wick from the late-January candle was followed by a wide under-side wick in early-February. The next few weeks presented a bit of struggle with a net bullish bias and that’s where we had the build of the ascending triangle. But this week’s candle is showing as a full body and that shows bullish conviction which keeps the door open for upside as we go into next week.
Gold Weekly Chart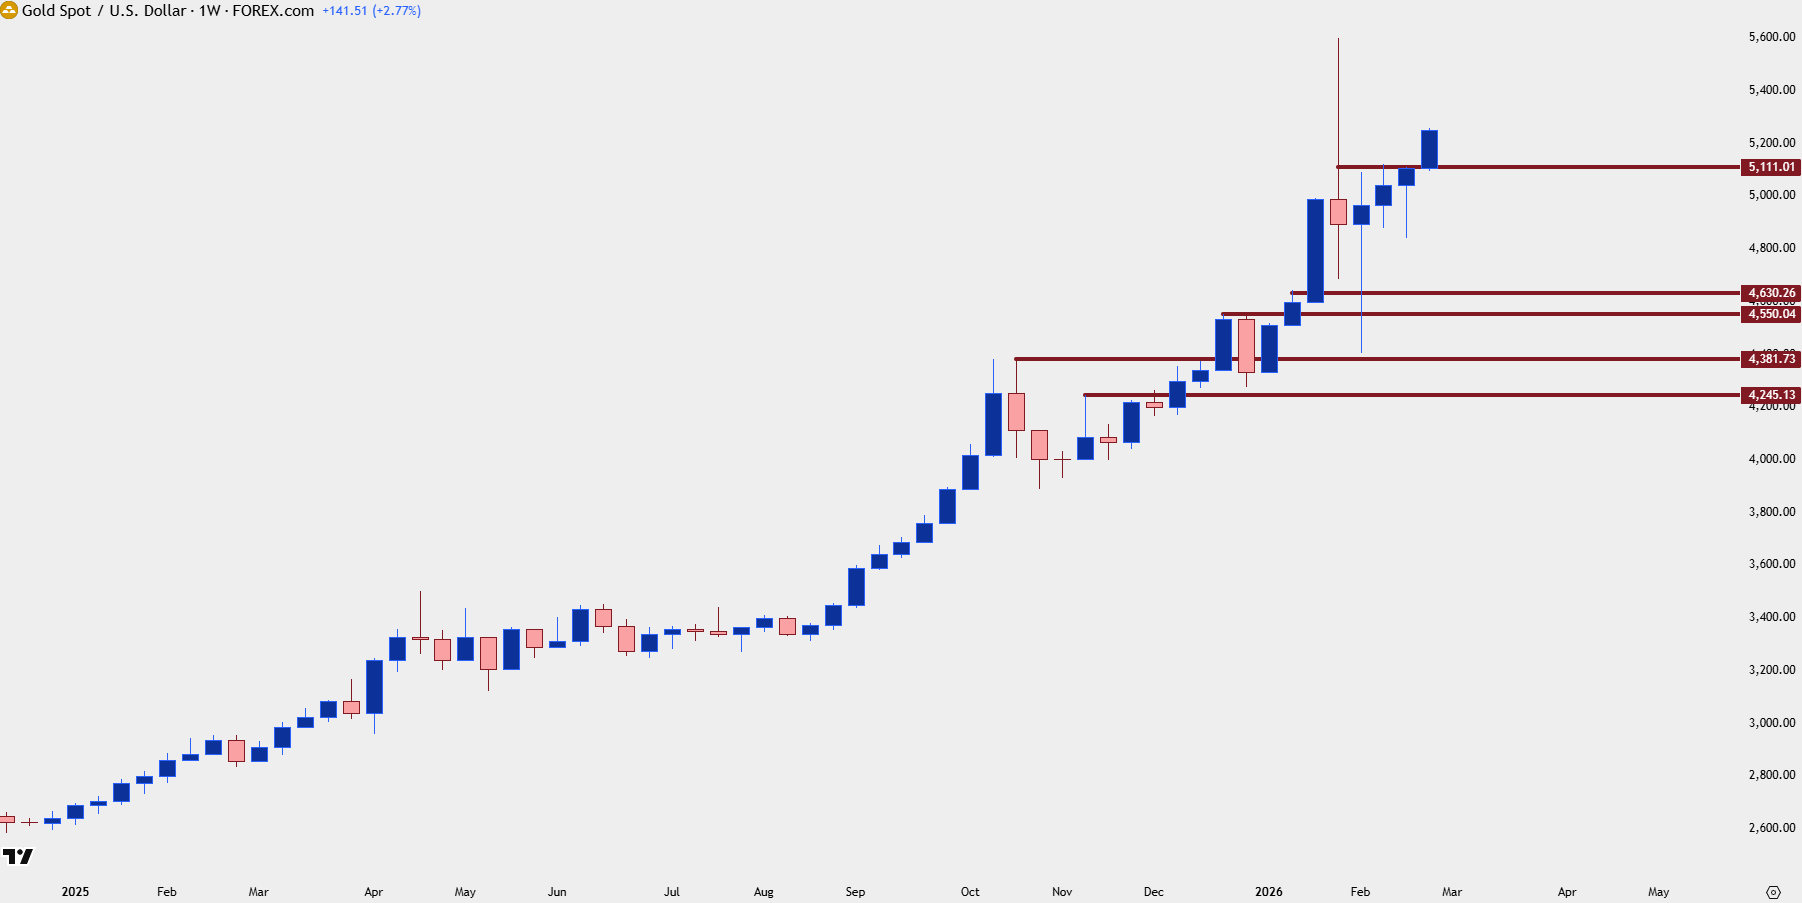
Chart prepared by James Stanley; data derived from Tradingview
Gold Daily
From the daily chart we can get good view of gold’s structure and price is currently testing a zone that spans from 5238-5270, which was support back in January before the turn and has since come back to hold the highs earlier in the week.
The pullback from that 5238 level held cleanly at the 5100 zone, which was ascending triangle resistance, and after some stalling around 5200 there was a late-week push back into resistance.
As we go into next week bulls are faced with the prospect of either chasing an already developed breakout or waiting for some element of pullback with which they can press bullish biases. And given the short-term resistance at 5191-5200, there’s an ideal spot for higher-low support to show for that scenario.
Gold Four-Hour Price Chart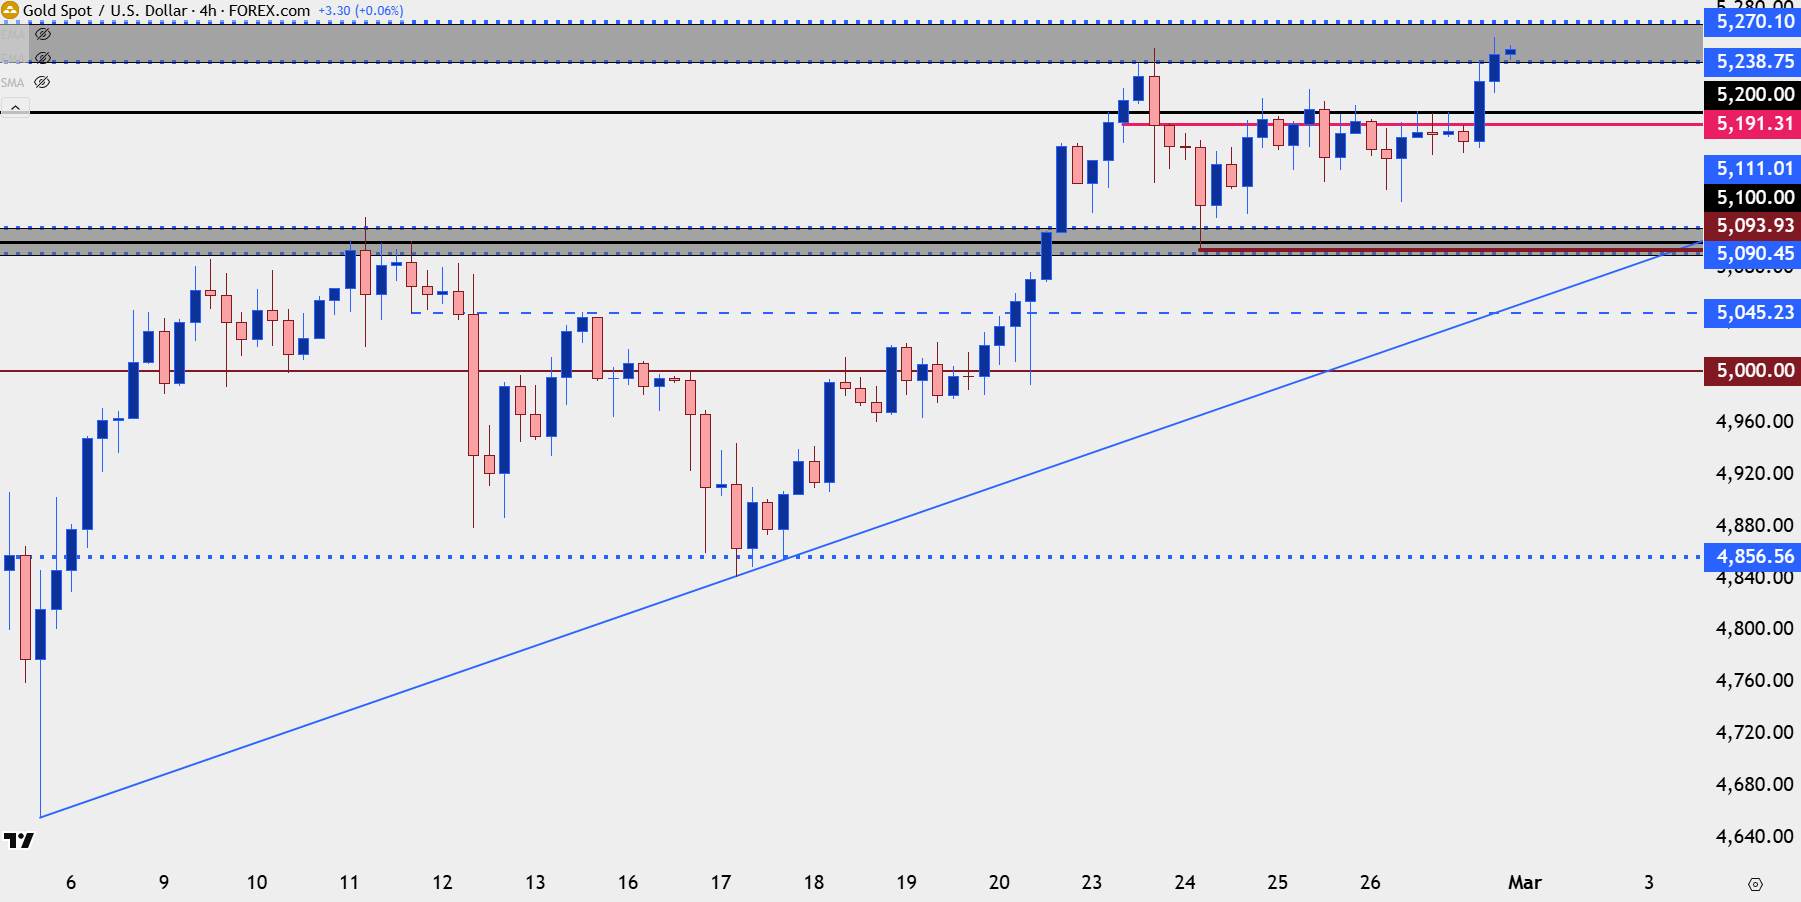
Chart prepared by James Stanley; data derived from Tradingview
--- written by James Stanley, Senior Market Analyst, Global Macro






