
This week’s webinar started off with another short-term setup in gold. Last week, I looked at the 5k level in-play as short-term support and that led to a rally up to the $5100 level. That price was well-defended from sellers and ultimately led to a push back below the major psychological level, and today’s session saw price digging in support at $4856 which, so far, has held for a bounce up to $4900.
In the webinar I explained the bigger picture backdrop around gold and why I retain a bullish outlook, longer-term. On a shorter-term basis, we’re still within the confines of consolidation but support can remain attractive for near-term setups.
Gold 30-Minute Chart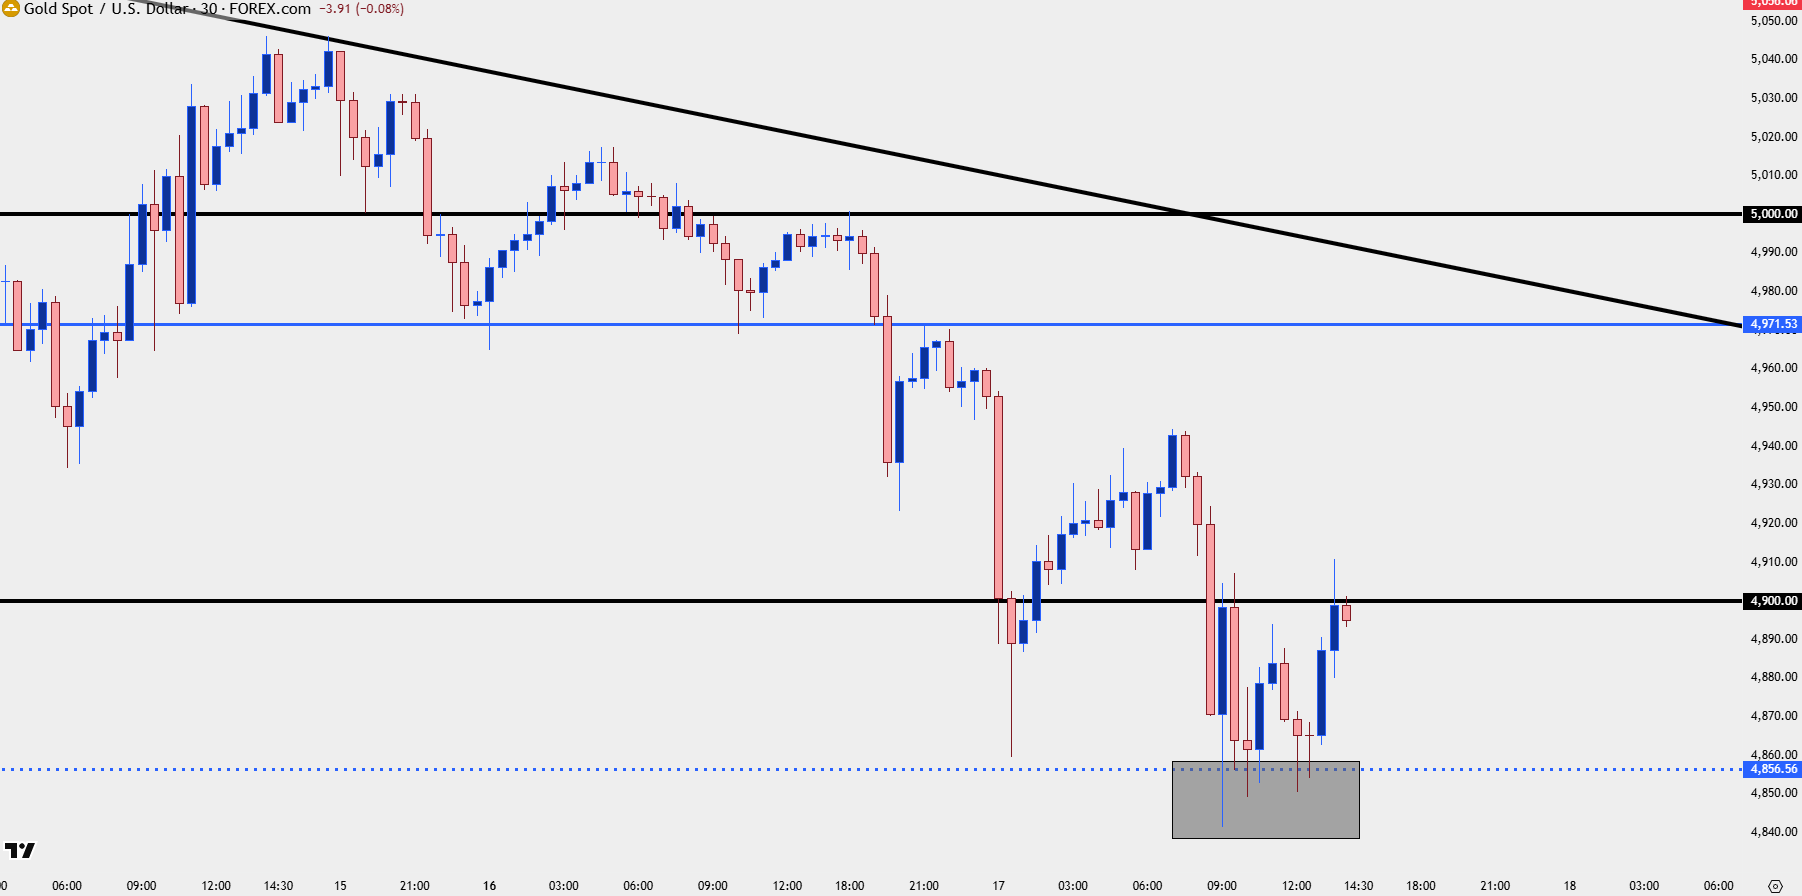
Chart prepared by James Stanley; data derived from Tradingview
Gold Big Picture
It’s the weekly chart that illustrates the prospect of consolidation, with extended wicks on either side narrowing into a tighter range.
Predicting consolidation breaks are as challenging as predicting any price movement – but it does open to the possibility of a trend-side bias in case that consolidation does break.
Gold Weekly Chart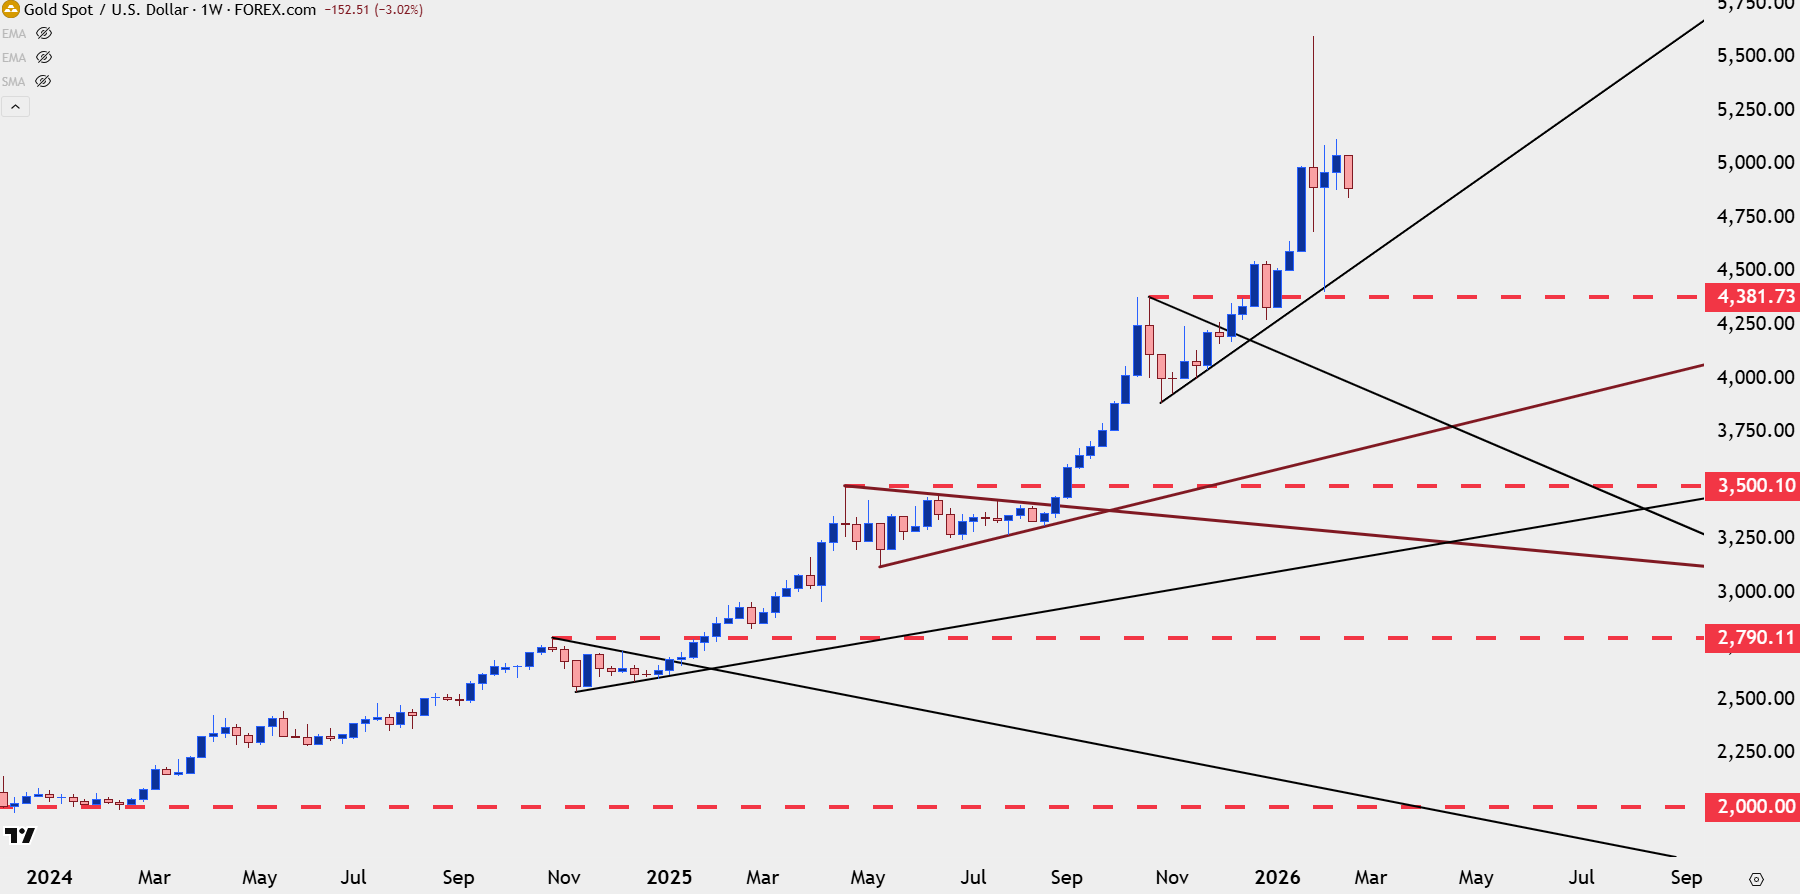
Chart prepared by James Stanley; data derived from Tradingview
USD
The US Dollar hit a fresh multi-year low a few weeks ago but since then sellers haven’t been able to do much with it. Last week did see some reaction to resistance but interestingly this happened amidst a backdrop that one would probably have expected to be bullish for the currency, in the form of a resounding election win for Sanae Takaichi in Japan and then a strong NFP report last Wednesday. Interestingly the item that did help to boost the USD was a softer-than-expected CPI report on Friday.
In the webinar I talked about sentiment and as usual attempted to take a balanced approach towards the USD, looking at a couple of setups on either side of the matter. Price is at a big point and like I said during the session, for bears, ideally this would be the area on the chart for price to hold.
US Dollar Four-Hour Chart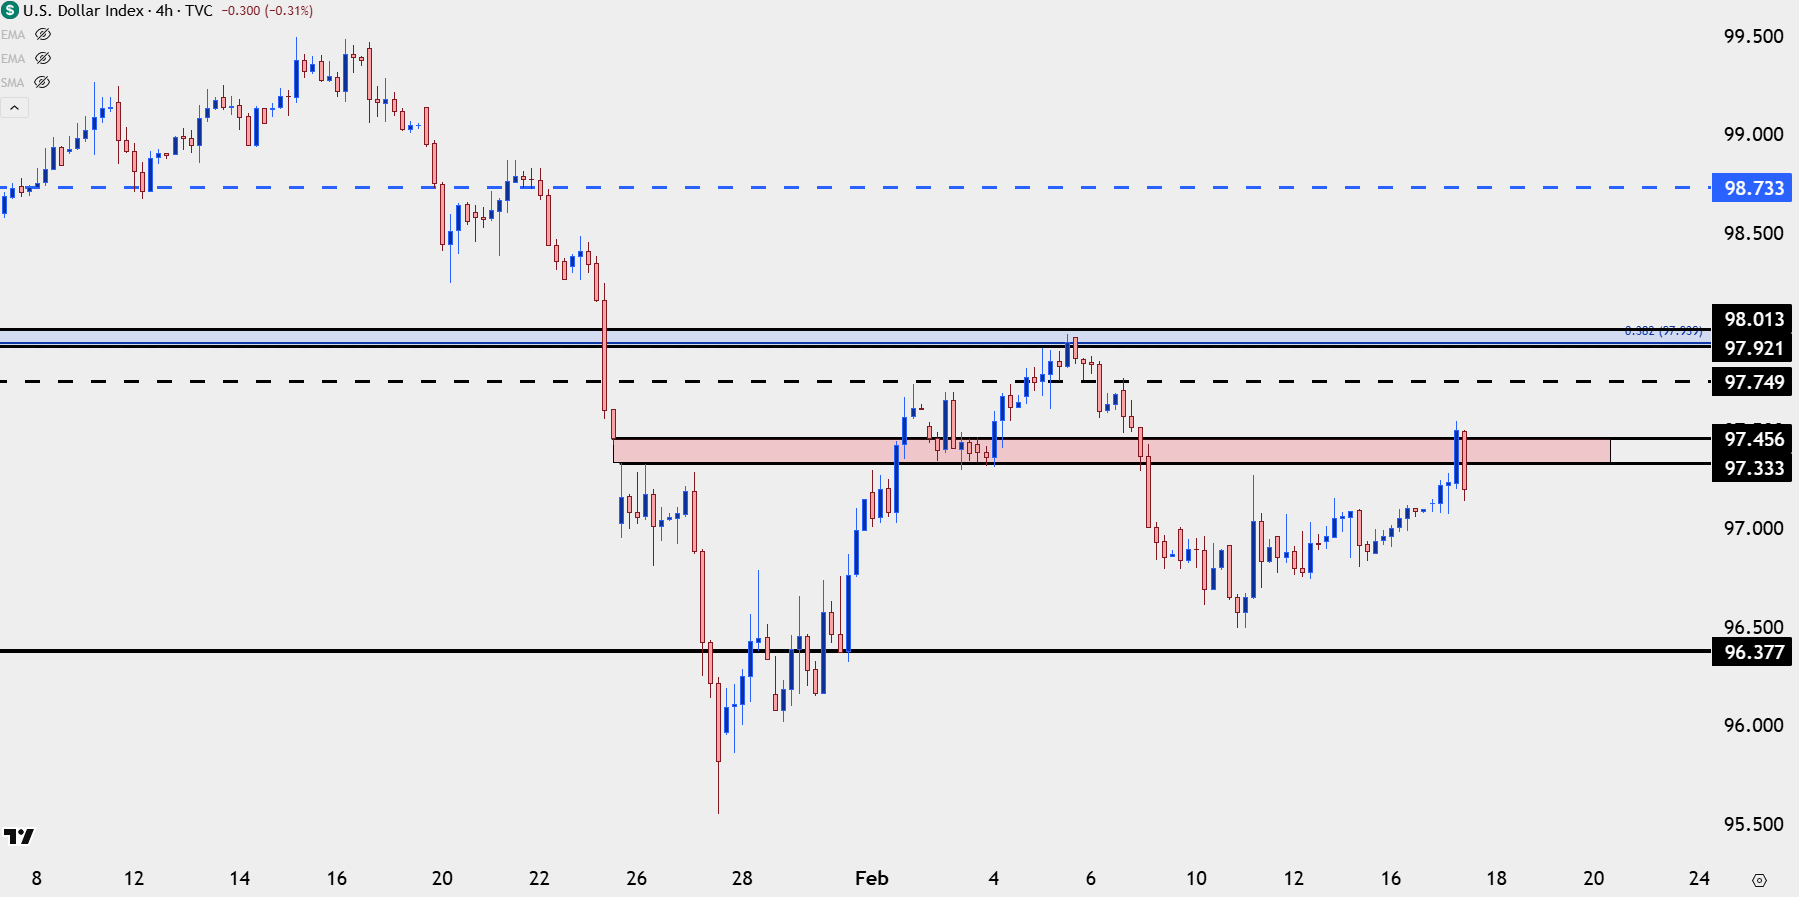
Chart prepared by James Stanley; data derived from Tradingview

USD/JPY
Last week saw a strong sell-off in USD/JPY and this was probably pretty surprising given the backdrop. But as I said in the webinar, if I was the Finance Minister and I wanted to maximize impact of intervention funds, the way that came in last week would probably have been the optimal way to do it.
Nonetheless USD/JPY finds itself back towards support and the question now is whether buyers respond and push the pair in the direction of the carry or whether the mild bounce we’ve seen so far induces more longer-term bulls to cut bait.
If the USD is going to continue the short-term rally USD/JPY strength seems a near necessity at this point.
USD/JPY Four-Hour Price Chart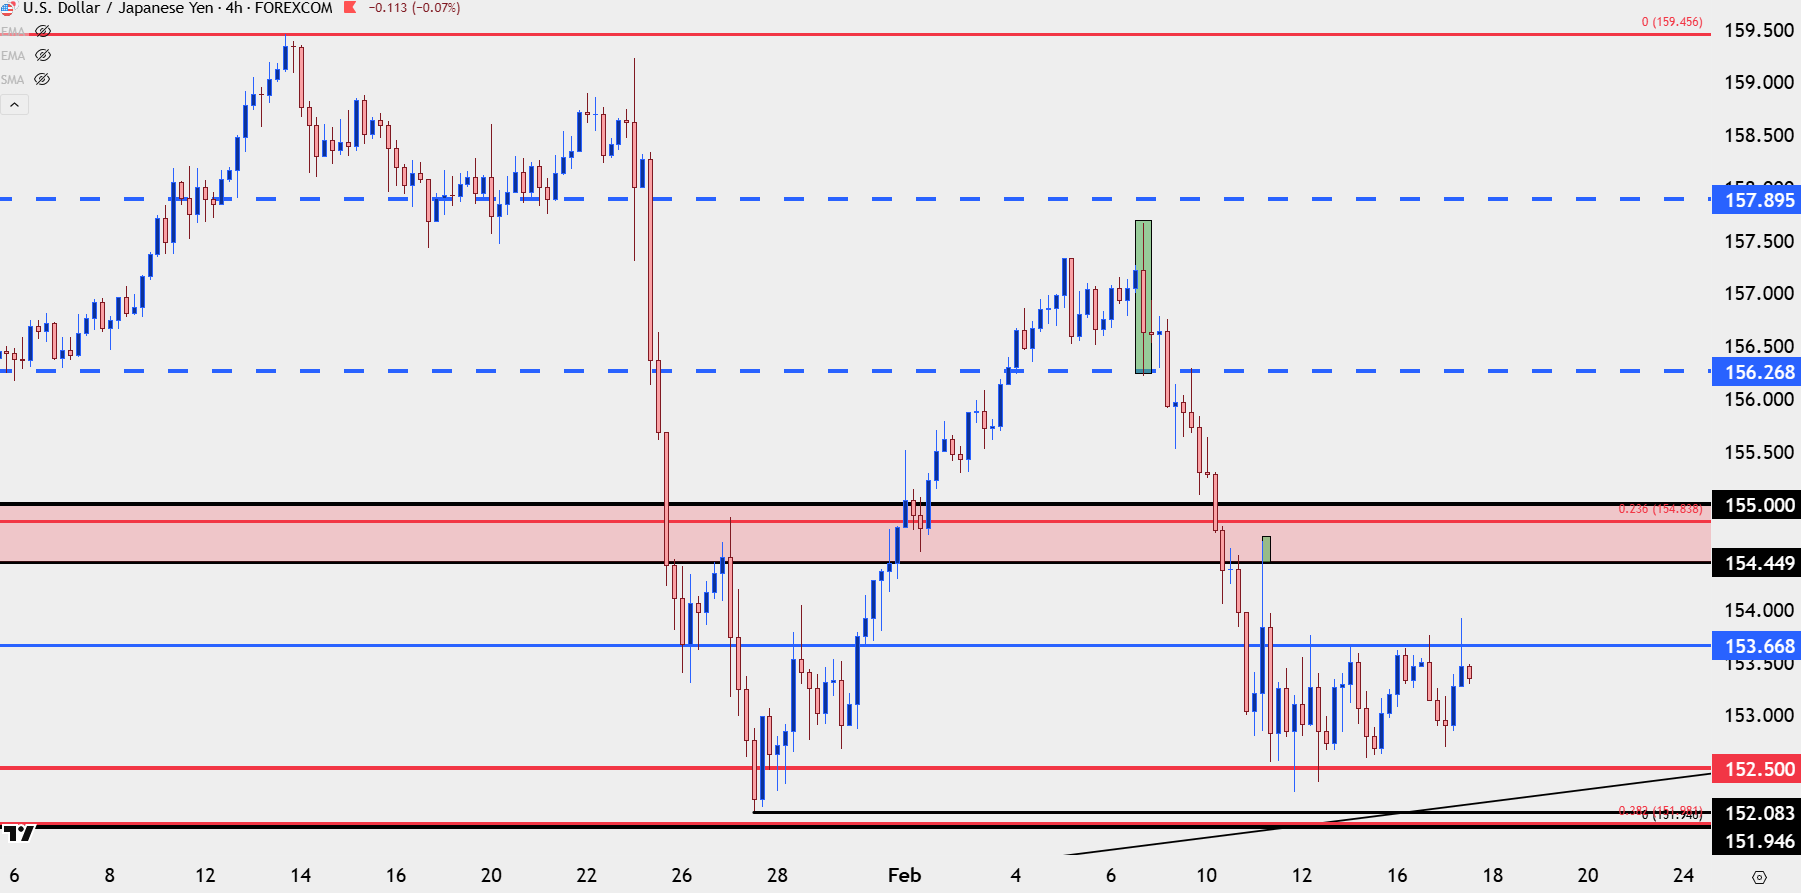
Chart prepared by James Stanley; data derived from Tradingview

EUR/USD
Interestingly despite the Euro being by far the largest component of the DXY basket it feels like other markets are doing the driving. For USD-weakness, however, this is still the pair that I prefer given recent structure and today has seen the 1.1805 level of prior resistance come in as support to set the lows.
As of this writing, there’s still a couple hours before the daily bar completes but if this finishes as a hammer it’s going to look attractive for a bounce up to the 1.1889 and perhaps even 1.1909-1.1919 zones.
EUR/USD Daily Price Chart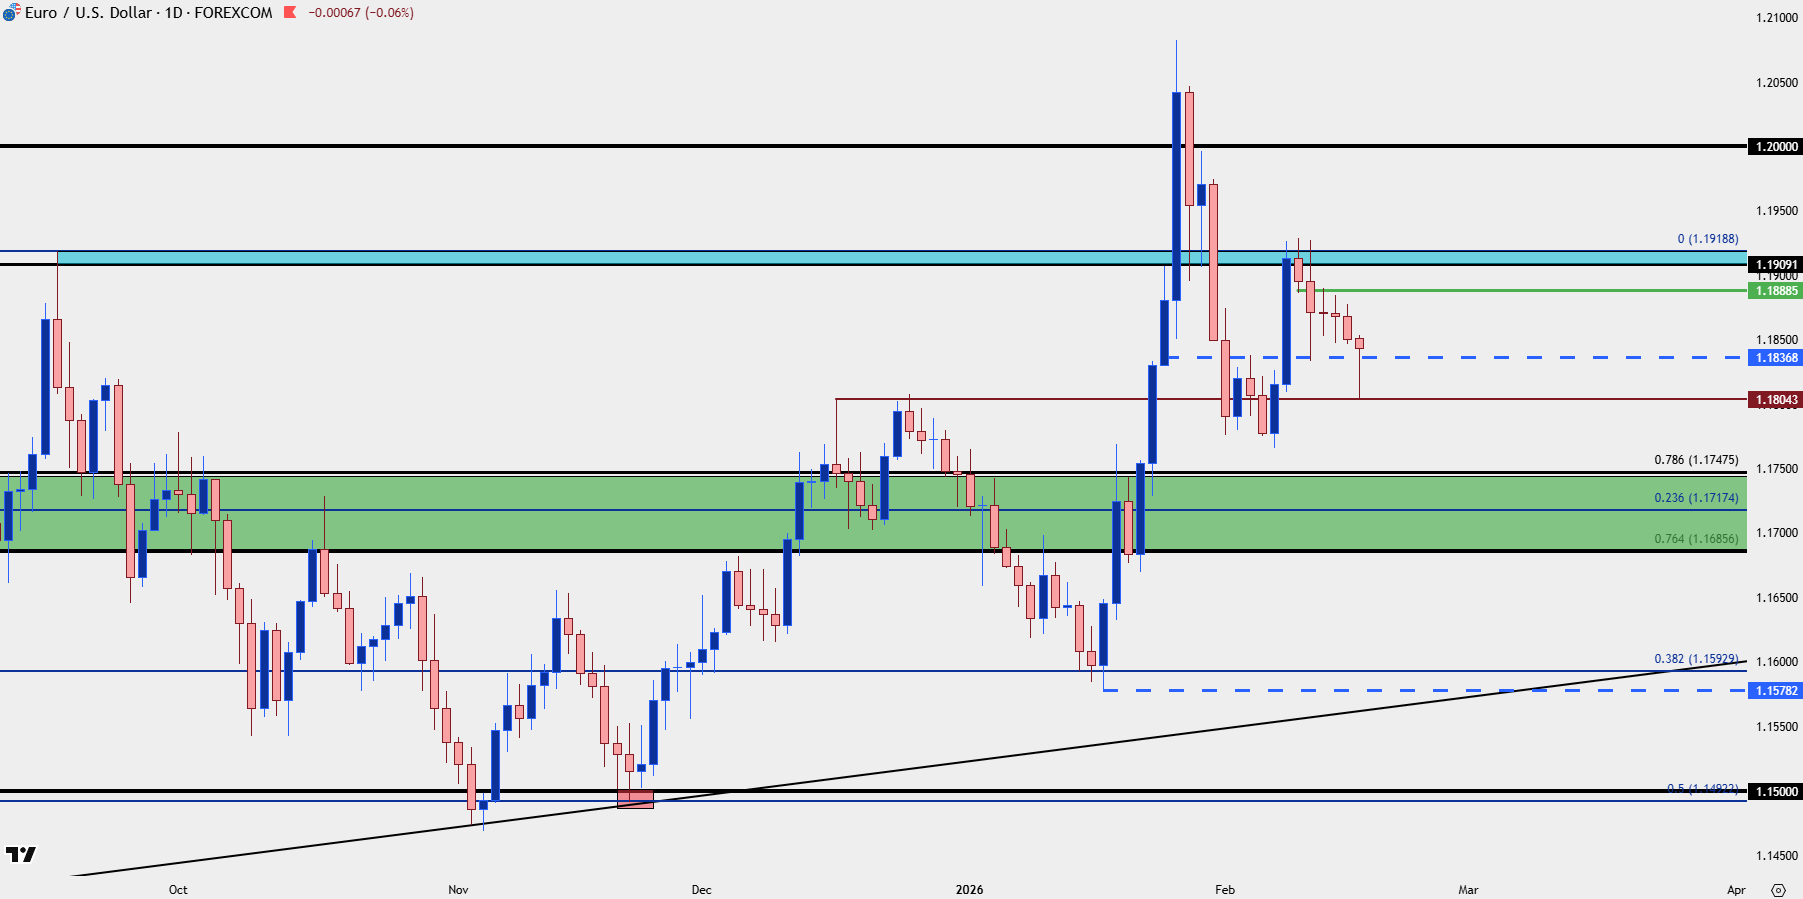
Chart prepared by James Stanley; data derived from Tradingview
GBP/USD
Cable has put in a test of the 1.3500 level and similarly this looks as though it can be an attractive backdrop for USD-weakness scenarios.
GBP/USD Daily Price Chart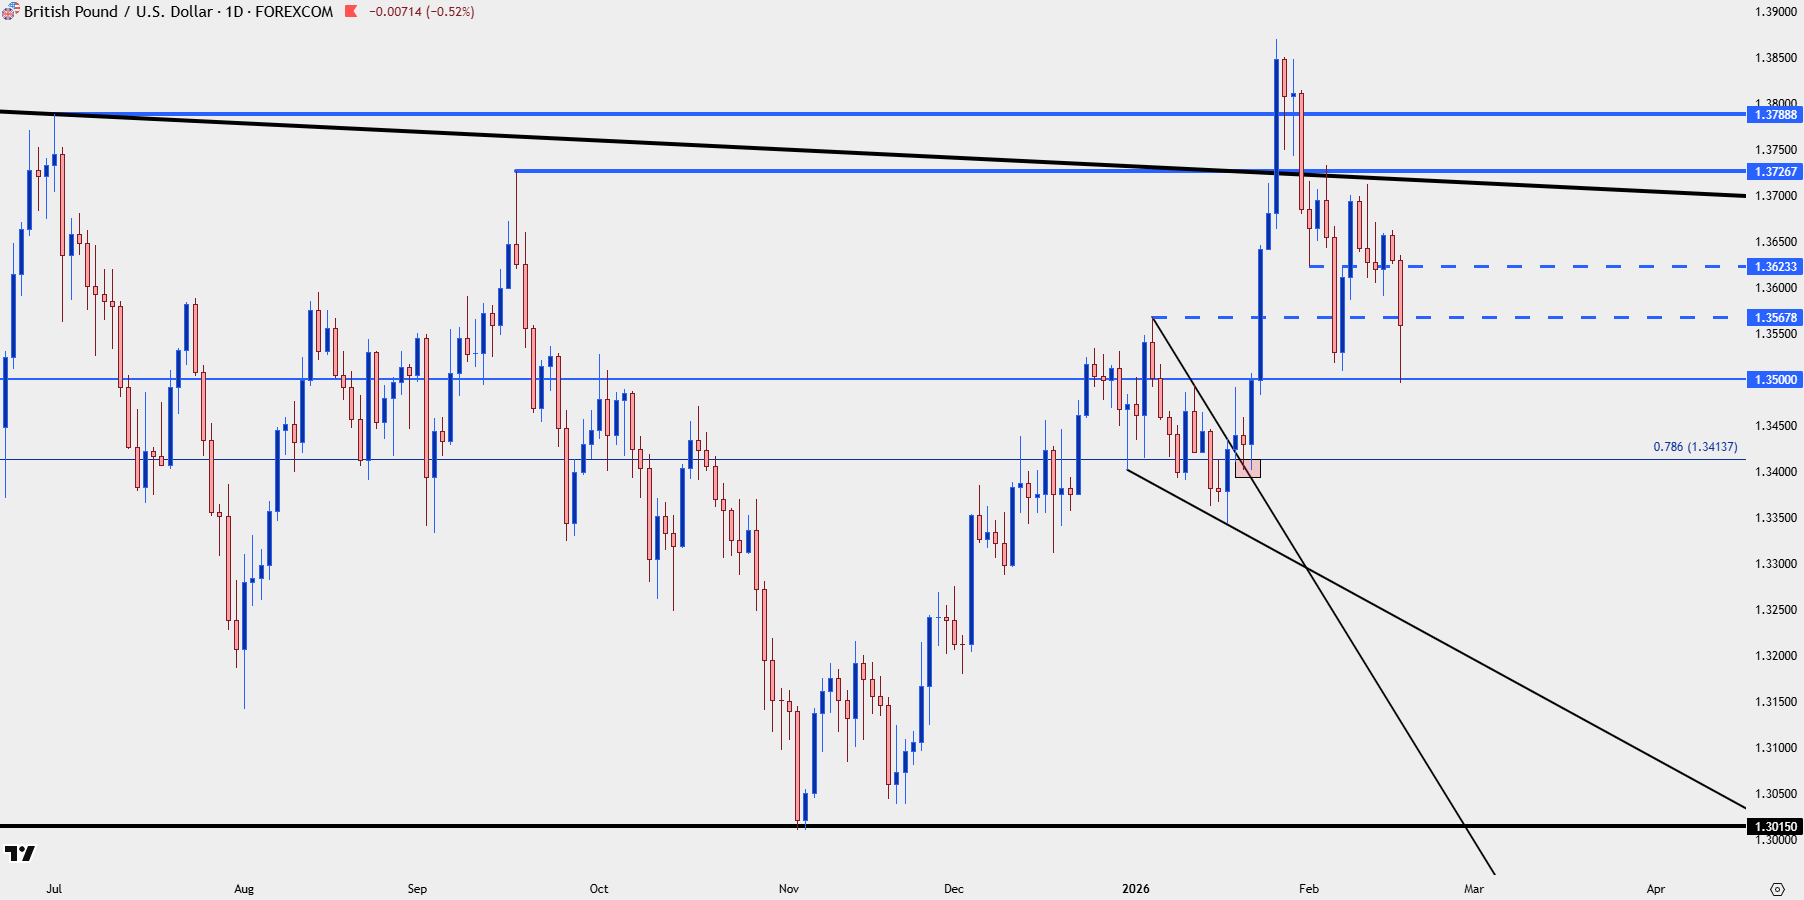
Chart prepared by James Stanley; data derived from Tradingview
USD/CAD
USD/CAD is another pair I’m keeping open for USD-strength setups. Interestingly it’s also the 1.3500 level that’s in-play here but that test is a bit more advanced, as the price traded a few weeks ago and so far bulls have held up a higher-low last week. I’ve put out multiple articles on this front and while the most bullish thing so far has been the deduction of waning bearishness, the comparison makes for an attractive backdrop if looking for a stronger USD but trying to avoid the messiness around the Japanese Yen.
USD/CAD Weekly Price Chart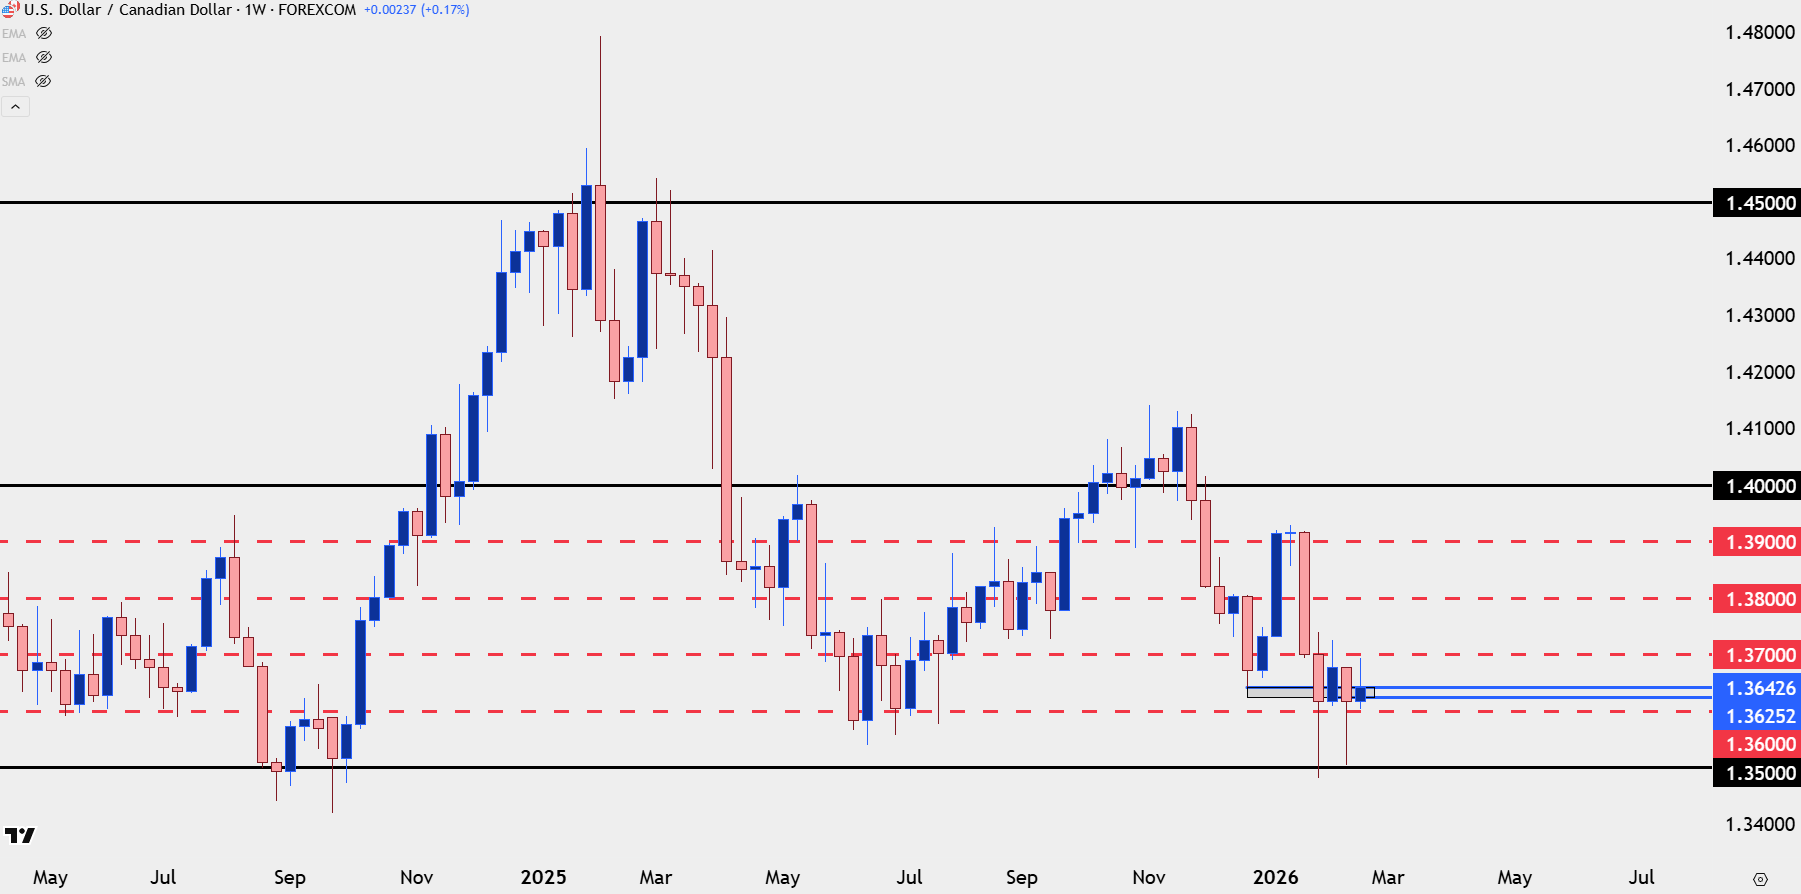
Chart prepared by James Stanley; data derived from Tradingview
--- written by James Stanley, Senior Market Analyst, Global Macro