



Gold Price Outlook: Bulls Weigh the Odds of Another Bounce Above $4,000
Gold is holding above $4,000 as softer US dollar momentum, a rebound in crude oil and favourable seasonality support the case for another rally.
Share this:

At the end of June, I outlined the potential for gold to bounce from the $4,000 level. While there was, of course, the obligatory noise around that key support, bulls eventually gained some traction, with gold rising 6.6% from last week's low to Friday's high. Although prices have since pulled back, XAU/USD continues to hold above its recent cycle lows, leaving bulls to ponder whether another leg higher could still unfold.
View related analysis:
View related analysis:
Why Gold Bulls May Still Have the Upper Hand
Gold Finds Support as Oil Rebounds and US Dollar Rally Fades
It was encouraging to see WTI crude oil prices also bounce from the support level I highlighted last week. Oil prices had fallen 44% from their post-war spike, printed their smallest bearish weekly candle in more than four months, yet consistently held above their pre-war close with near perfection. Crude oil prices have risen by as much as 13% from last week's low as President Trump once again verbally attacks Iran, making it easy work for bulls after an extended selloff into a key support level.
Gold's price action is more nuanced for bulls, but they may still have a case for a cheeky bounce higher, at least over the near term.
Net-long exposure to the US dollar may be nearing a sentiment extreme, which I outlined again in my weekly Commitment of Traders (COT) report. Bulls have also lost a little momentum on the US dollar index rally, which is helping gold hold above 4,000 for now.
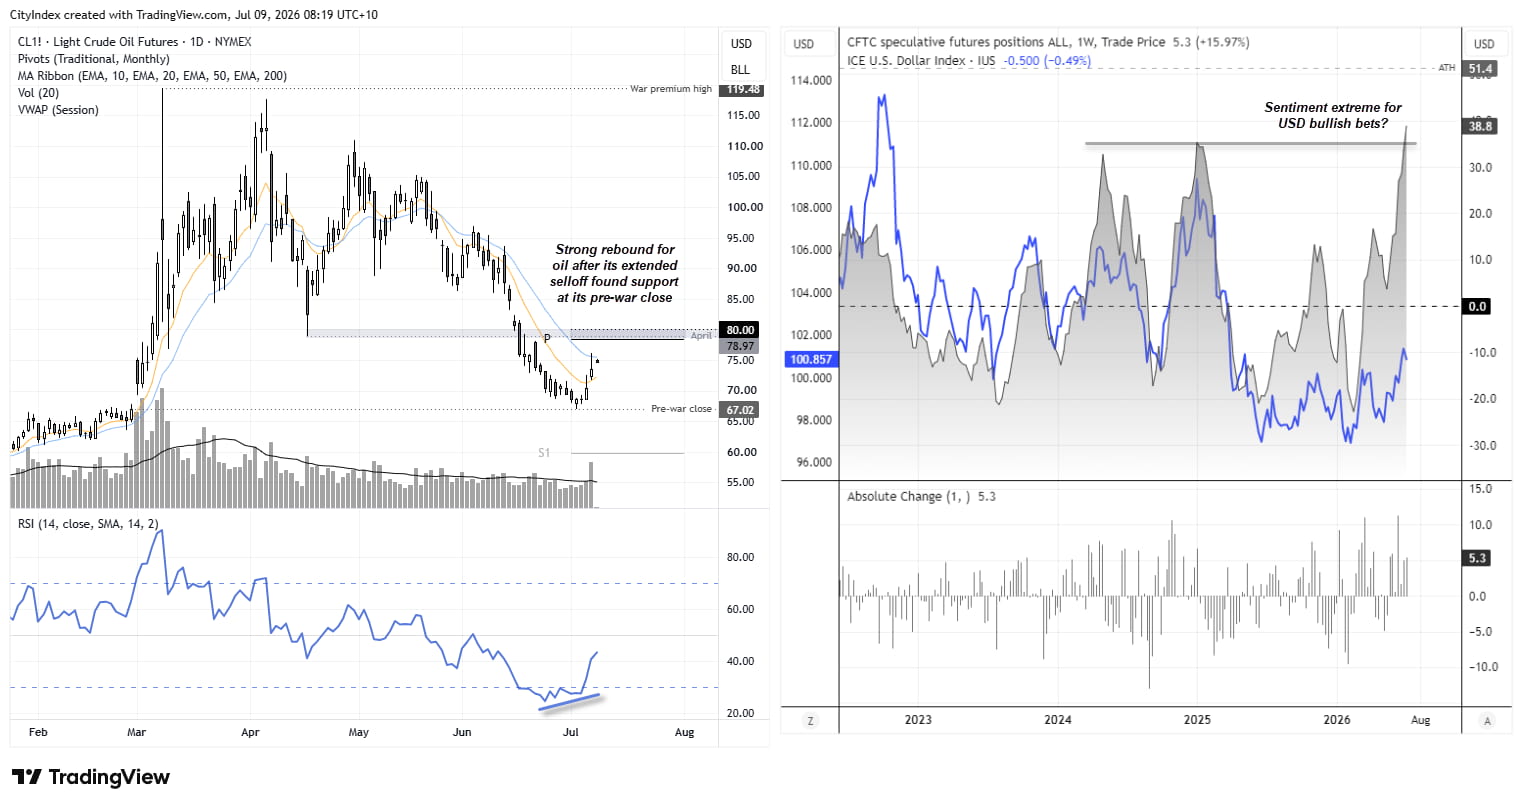
Source: NYMEX, ICE, IMM, CFTC (COT)
Gold Seasonality Favors Bulls in July and August
July tends to offer a slight seasonal advantage for bulls, with data since 2000 showing average and median returns of around 1% and a 56% win rate. Among those bullish Julys, the average gain has been 3.8%. August seasonality is even stronger, with a 64% win rate, average and median returns of around 2%, and an average gain of 4.3% during bullish months.
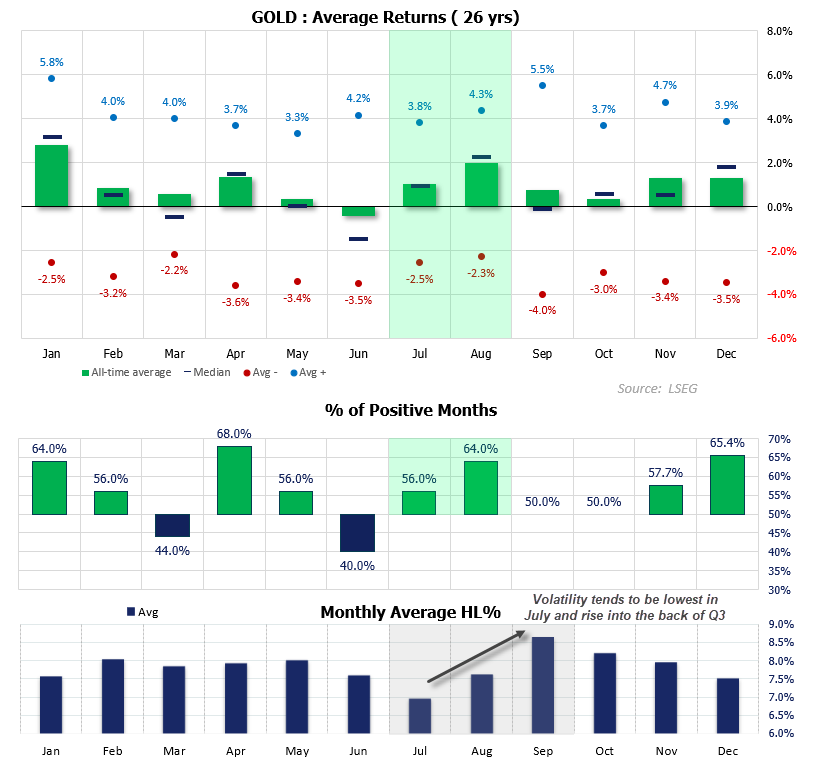
Source: LSEG


Gold's Daily July Seasonality Points to a Bullish Window
Seasonal patterns may not provide a roadmap for the future, but they can highlight tendencies in price action during quieter periods that are not overshadowed by major economic or geopolitical drivers. With volatility seemingly lower for now and markets seeking a fresh catalyst, perhaps seasonality can play out in the weeks ahead. On that note, gold's daily returns during July also show that 8–13 July tend to deliver positive average returns alongside mostly favourable win rates. Extra caution is warranted when interpreting daily seasonality data, but the pattern is at least worth highlighting.
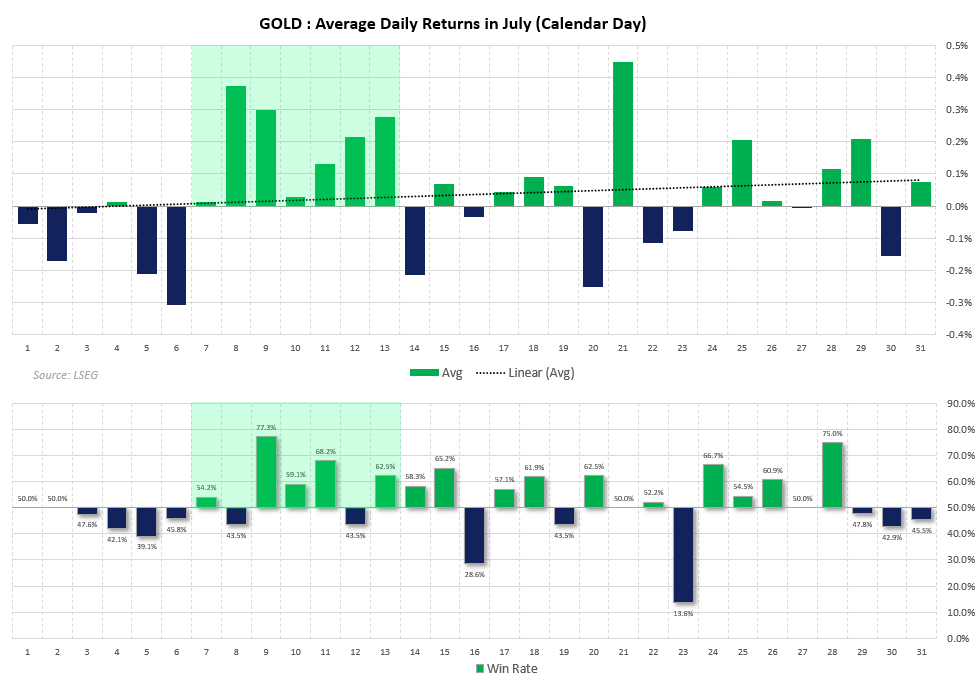
Source: LSEG
Gold Futures (GC) Technical Analysis
Daily Chart: Gold Bulls Eye a C-Wave Recovery
The daily chart shows that while gold remains in a downtrend, it has staged a countertrend rally. The question now is whether bulls have enough fuel in the tank for another leg higher as part of a potential ABC correction. The 20-day EMA continues to cap prices as resistance and momentum has turned lower, yet Wednesday's wide-legged doji suggests bears may already be losing their grip. The fact that this has occurred above 4,000, while gold has entered a period of the month with a slight bullish seasonal tailwind, adds weight to the case for another move higher over the near term as part of the 'C' wave of an ABC correction.


1-Hour Chart: Volume Still Needs to Confirm the Bounce
The 1-hour chart shows Wednesday's low respected last week's volume point of control (VPOC), adding further weight to the case for a potential swing low. That said, volumes during the recent bounce from those lows have declined, suggesting a lack of bullish participation. Bulls may therefore want to remain on guard for a pullback within yesterday's range today.
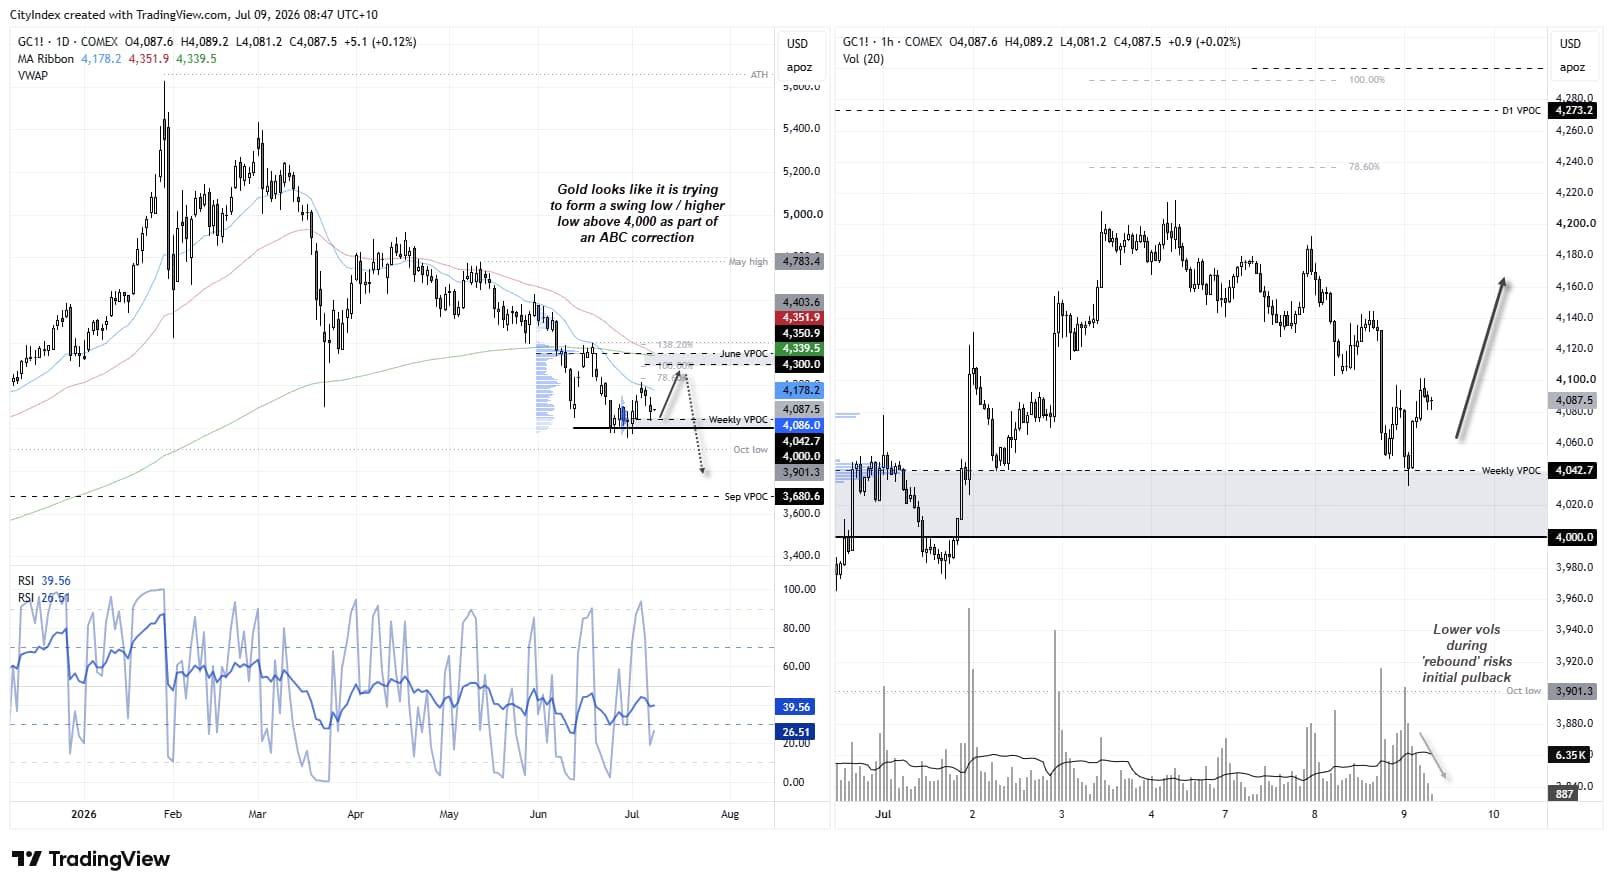
Source: LSEG
- My near-term bias remains bullish while gold holds above the recent swing lows, and with Wednesday's doji forming above 4,000, bulls may be preparing to make their next move.
- A bullish divergence formed on the daily RSI (14) heading into the swing lows, suggesting the mature bearish trend has been losing momentum.
- Note that the 200-day and 50-day EMAs sit near the June volume point of control (VPOC), just above the 4,300 handle.
- A 100% projection of Wave A from the assumed Wave B low lands near the 4,300 handle.
- With a notable cluster of resistance between 4,300 and 4,340, bears may also be lurking to capitalise on any such bounce with a view to taking gold back below 4,000.
View the full economic calendar
View the full economic calendar
-- Written by Matt Simpson
Follow Matt on Twitter @cLeverEdge
How to trade with City Index
You can trade with City Index by following these four easy steps:
- Open an account, or log in if you’re already a customer
• Open an account in the UK
• Open an account in Australia
• Open an account in Singapore
- Search for the market you want to trade in our award-winning platform
- Choose your position and size, and your stop and limit levels
- Place the trade
Related tags:




Open an account in minutes
Experience award-winning platforms with fast and secure execution.
Economic calendar
Web Trader platform
Our sophisticated web-based platform is packed with features.
Related articles

S&P 500 forecast: SPX struggles for direction ahead of PPI data
U.S. stocks are struggling for direction on Friday as investors continue to weigh up the fallout from Nvidia’s leadership change, rising Treasury yields and the upcoming U.S. producer price inflation data.


Gold outlook: seasonal tailwind offers hope with XAU/USD below $4,000
A historically stronger seasonal window and steady central bank buying are offering gold some hope after its slide to a fresh 2026 low. Reclaiming the 4,000 mark is the first sign that the metal may have found a floor.


Bitcoin, Gold Outlook: Bullish Hold or Bearish Shift?
Bitcoin, Gold Outlook: The dollar’s surge to new 2026 highs and approach toward nine-month resistance are raising near-term reversal risks across precious metals and currency markets. This follows recent declines that pushed Bitcoin below $70,000 and gold below $3,870.

The information on this web site is not targeted at the general public of any particular country. It is not intended for distribution to residents in any country where such distribution or use would contravene any local law or regulatory requirement. The information and opinions in this report are for general information use only and are not intended as an offer or solicitation with respect to the purchase or sale of any currency or CFD contract. All opinions and information contained in this report are subject to change without notice. This report has been prepared without regard to the specific investment objectives, financial situation and needs of any particular recipient. Any references to historical price movements or levels is informational based on our analysis and we do not represent or warranty that any such movements or levels are likely to reoccur in the future. While the information contained herein was obtained from sources believed to be reliable, author does not guarantee its accuracy or completeness, nor does author assume any liability for any direct, indirect or consequential loss that may result from the reliance by any person upon any such information or opinions.
Futures, Options on Futures, Foreign Exchange and other leveraged products involves significant risk of loss and is not suitable for all investors. Losses can exceed your deposits. Increasing leverage increases risk. Spot Gold and Silver contracts are not subject to regulation under the U.S. Commodity Exchange Act. Contracts for Difference (CFDs) are not available for US residents. Before deciding to trade forex, commodity futures, or digital assets, you should carefully consider your financial objectives, level of experience and risk appetite. Any opinions, news, research, analyses, prices or other information contained herein is intended as general information about the subject matter covered and is provided with the understanding that we do not provide any investment, legal, or tax advice. You should consult with appropriate counsel or other advisors on all investment, legal, or tax matters. References to FOREX.com or GAIN Capital refer to StoneX Group Inc. and its subsidiaries. Please read Characteristics and Risks of Standardized Options.