





Gold Rally Stalls Below Monthly High: Is a Deeper Pullback Brewing?
Gold may fail to break the prior month’s high for the first time in 2024 — a signal that preceded a two-month retracement last year. With overbought signals flashing on higher timeframes, traders should be on alert for a potential deeper correction.
Share this:

Gold Futures (GC) Technical Analysis
It seems far more likely than not that gold will go on to print new highs this year, given the strength of its bullish trend and supporting fundamentals. However, it appears to be undergoing a much-needed correction — potentially a welcome opportunity for sidelined bulls waiting to reload at more favourable prices.
Gold Futures (GC): Monthly Chart
Gold’s parabolic trend began in March 2024, following a breakout from an inverted head and shoulders (H&S) pattern that reached its projected upside target of ~2800 within seven months. After a two-month retracement, bulls regained control, driving prices as high as 3500.
However, it now seems likely that gold will fail to take out the previous month’s high for the first time this year. With just one week of the month remaining, gold is currently on track to print a spinning top doji, having met resistance around 3400 — just beneath its all-time high (ATH).
The monthly RSI (14) remains extremely overbought, while a bearish divergence has formed in the oversold zone of the RSI (2).
Support has been found around the 23.6% Fibonacci ratio ~3140, though a break beneath it opens up a run for the 38.2% fib level near the 10-month SMA and 2900 handle.
Gold Futures (GC): Weekly and Daily Chart
Time will tell whether the monthly timeframe is in for a deeper pullback. For now, we can hone in on the weekly and daily charts for a potential near-term setup.
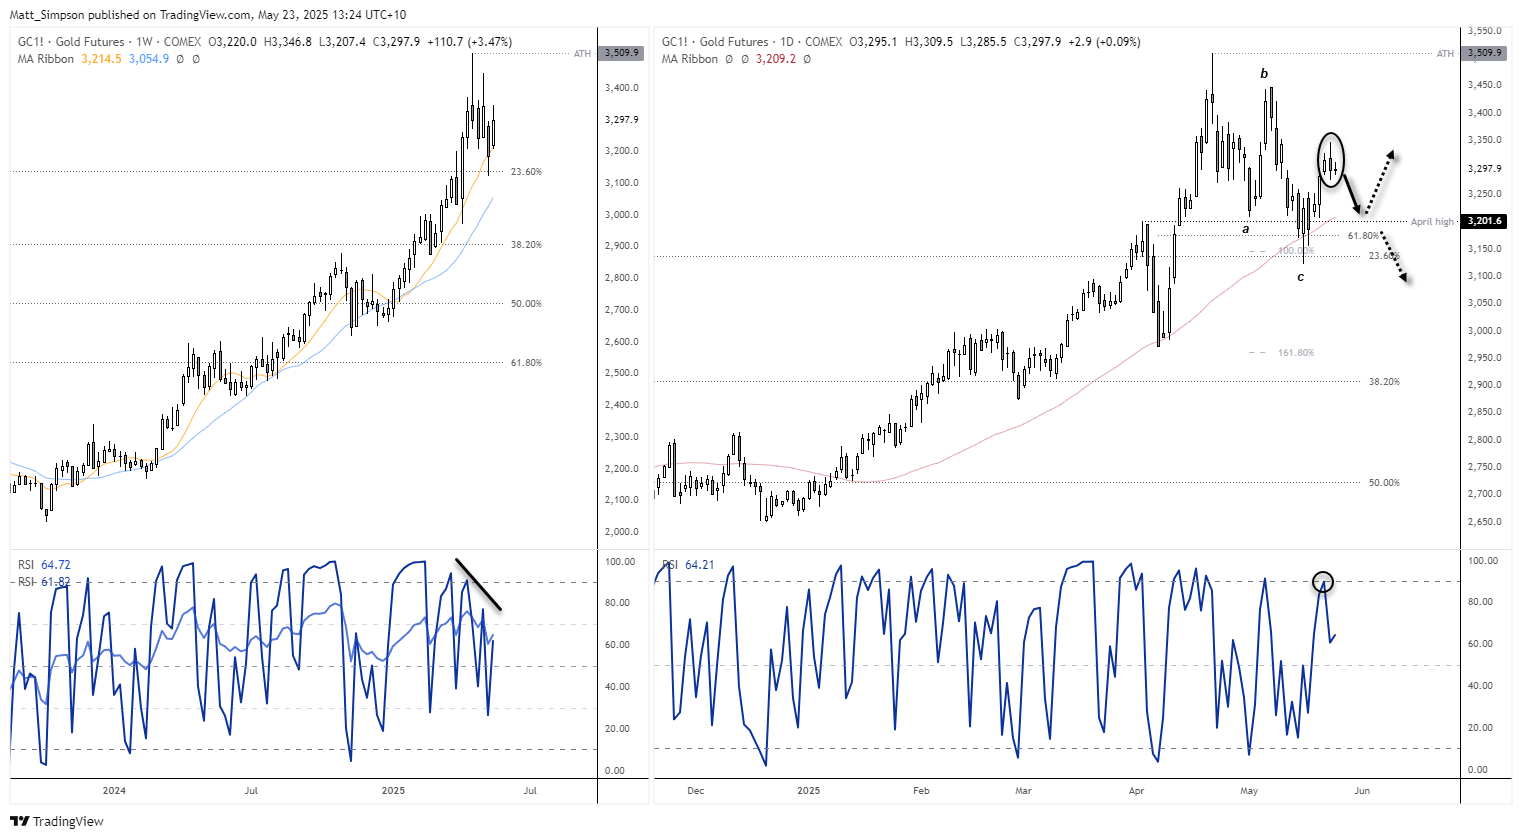
Choppier price action is already apparent on the weekly chart and has been accompanied by a bearish divergence on the RSI (2).
The daily chart shows that gold has completed the ABC correction I suggested earlier in May. The end of wave C found support near the long-term 23.6% Fibonacci retracement and the 100% projection of wave A to B. The recent closing lows also held above a smaller 61.8% Fibonacci level, suggesting that gold may not be ready to break beneath the 3180 level — at least for now.
However, a bearish outside day formed on Thursday, with the RSI (2) rising to 89.7 — nearing the typical overbought threshold of 90. This hints that a pullback toward the 50-day SMA around the 3200 handle could be on the cards in the near term.
If such a pullback occurs, how prices react around the 3180–3200 zone could offer better insight into whether the ABC correction is indeed complete (and a rally to new highs is likely), or if a deeper pullback is still yet to unfold.
-- Written by Matt Simpson
Follow Matt on Twitter @cLeverEdge
How to trade with City Index
You can trade with City Index by following these four easy steps:
- Open an account, or log in if you’re already a customer
• Open an account in the UK
• Open an account in Australia
• Open an account in Singapore
- Search for the market you want to trade in our award-winning platform
- Choose your position and size, and your stop and limit levels
- Place the trade
Related tags:
Latest market news




Open an account in minutes
Experience award-winning platforms with fast and secure execution.
Economic calendar
Web Trader platform
Our sophisticated web-based platform is packed with features.
Related articles

Gold outlook: seasonal tailwind offers hope with XAU/USD below $4,000
A historically stronger seasonal window and steady central bank buying are offering gold some hope after its slide to a fresh 2026 low. Reclaiming the 4,000 mark is the first sign that the metal may have found a floor.


Bitcoin, Gold Outlook: Bullish Hold or Bearish Shift?
Bitcoin, Gold Outlook: The dollar’s surge to new 2026 highs and approach toward nine-month resistance are raising near-term reversal risks across precious metals and currency markets. This follows recent declines that pushed Bitcoin below $70,000 and gold below $3,870.


Gold, EUR/USD hit 2026 lows as US yields erupt
US Treasury yields have staged one of their largest four-session increases in decades, hammering EUR/USD and gold. But while the euro's decline makes sense, gold's reaction has been extraordinary.

The information on this web site is not targeted at the general public of any particular country. It is not intended for distribution to residents in any country where such distribution or use would contravene any local law or regulatory requirement. The information and opinions in this report are for general information use only and are not intended as an offer or solicitation with respect to the purchase or sale of any currency or CFD contract. All opinions and information contained in this report are subject to change without notice. This report has been prepared without regard to the specific investment objectives, financial situation and needs of any particular recipient. Any references to historical price movements or levels is informational based on our analysis and we do not represent or warranty that any such movements or levels are likely to reoccur in the future. While the information contained herein was obtained from sources believed to be reliable, author does not guarantee its accuracy or completeness, nor does author assume any liability for any direct, indirect or consequential loss that may result from the reliance by any person upon any such information or opinions.
Futures, Options on Futures, Foreign Exchange and other leveraged products involves significant risk of loss and is not suitable for all investors. Losses can exceed your deposits. Increasing leverage increases risk. Spot Gold and Silver contracts are not subject to regulation under the U.S. Commodity Exchange Act. Contracts for Difference (CFDs) are not available for US residents. Before deciding to trade forex, commodity futures, or digital assets, you should carefully consider your financial objectives, level of experience and risk appetite. Any opinions, news, research, analyses, prices or other information contained herein is intended as general information about the subject matter covered and is provided with the understanding that we do not provide any investment, legal, or tax advice. You should consult with appropriate counsel or other advisors on all investment, legal, or tax matters. References to FOREX.com or GAIN Capital refer to StoneX Group Inc. and its subsidiaries. Please read Characteristics and Risks of Standardized Options.