



Hang Seng Tech bulls searching for an antidote
The headlines have changed. The market's response hasn't, leaving bulls facing the same major technical hurdle overhead.
Share this:

- Price action still refuses to reward bullish narratives
- Key resistance continues to repel every rally
- Push above 5,215 breaks sequence of lower highs
Good news, same outcome
There have been plenty of bullish narratives thrown at Hang Seng Tech since late last week. Yet, as has so often been the case when the index reaches this technical juncture, it continues to struggle for traction.
China's "national team" stepped in to support mainland equities following the sharp sell-off. TSMC reiterated that AI demand remains a multi-year structural story while unveiling another US$100 billion investment in Arizona. CXMT's blockbuster IPO, slated to list next week, continued to attract enormous institutional and retail demand despite enthusiasm proving less frenzied than recent technology listings. Meanwhile, Kimi K3 reinforced that China's AI capabilities continue to advance, even if it also prompted investors to reassess AI valuations more broadly.
The headlines have changed. The market's response hasn't.
As has been the case repeatedly in recent months, there has been no shortage of reasons for the bulls to be optimistic. Yet the market has consistently failed to reward that optimism.
The barrier bulls still can't break
Source: TradingView
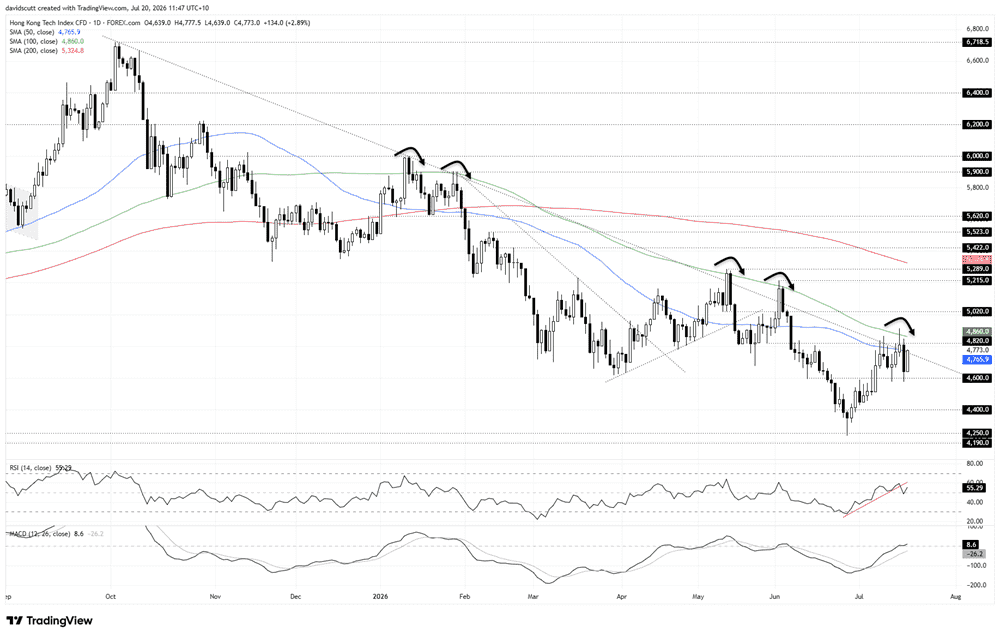
The technical picture explains why. Since peaking in October 2025, the descending trendline, 100-day moving average and, more recently, horizontal resistance around 4,820 have repeatedly combined to repel rallies. Unless buyers can finally deliver a decisive close above this zone, there's a growing risk the latest rebound proves to be another false dawn rather than the start of a more durable advance.
Even if cleared, bulls would still have another obstacle to overcome at 5,020 before a retest of the June high at 5,215 comes into view. Only a break above there would finally interrupt the sequence of lower highs that's been in place since October.
On the downside, 4,600 remains the first level to watch. It has repeatedly acted as both support and resistance, including during last week's sharp sell-off. A decisive break below would expose 4,400 initially, before bringing the June swing low near 4,250 into focus.
The oscillators are not delivering a definitive message on directional risks, with the picture further clouded by headlines surrounding China's national team buying. RSI (14) has broken its short-term uptrend and is hovering around the neutral 50 level, while MACD has only just crossed into positive territory. For now, I'd be inclined to place greater weight on price action than the oscillators.
Latest market news




Open an account in minutes
Experience award-winning platforms with fast and secure execution.
Economic calendar
Web Trader platform
Our sophisticated web-based platform is packed with features.
Related articles
S&P 500, Nasdaq 100 Claw Back But NVDA Cloud Looms Overhead
Last week was green for both the Nasdaq and S&P 500 but given the sell-off that led into that bounce there’s still a very real question as to whether bears still have a statement to make. And the NVDA situation presents a very real threat.
Australian Dollar Forecast: AUD/USD Breaks Multi-Month Range, Hits 10-Month Low 11 14 2026
Aussie bears are closing in on major technical support, with next week's Australian employment data raising the stakes for a pivotal reaction.

USD/JPY Weekly Outlook: Bulls Eye Higher Range After Historic Rate Shock
A historic US rate shock has sent USD/JPY above 160, but with intervention risks rising and few major economic catalysts ahead, AI sentiment could hold the key to the next move.
The information on this web site is not targeted at the general public of any particular country. It is not intended for distribution to residents in any country where such distribution or use would contravene any local law or regulatory requirement. The information and opinions in this report are for general information use only and are not intended as an offer or solicitation with respect to the purchase or sale of any currency or CFD contract. All opinions and information contained in this report are subject to change without notice. This report has been prepared without regard to the specific investment objectives, financial situation and needs of any particular recipient. Any references to historical price movements or levels is informational based on our analysis and we do not represent or warranty that any such movements or levels are likely to reoccur in the future. While the information contained herein was obtained from sources believed to be reliable, author does not guarantee its accuracy or completeness, nor does author assume any liability for any direct, indirect or consequential loss that may result from the reliance by any person upon any such information or opinions.
Futures, Options on Futures, Foreign Exchange and other leveraged products involves significant risk of loss and is not suitable for all investors. Losses can exceed your deposits. Increasing leverage increases risk. Spot Gold and Silver contracts are not subject to regulation under the U.S. Commodity Exchange Act. Contracts for Difference (CFDs) are not available for US residents. Before deciding to trade forex, commodity futures, or digital assets, you should carefully consider your financial objectives, level of experience and risk appetite. Any opinions, news, research, analyses, prices or other information contained herein is intended as general information about the subject matter covered and is provided with the understanding that we do not provide any investment, legal, or tax advice. You should consult with appropriate counsel or other advisors on all investment, legal, or tax matters. References to FOREX.com or GAIN Capital refer to StoneX Group Inc. and its subsidiaries. Please read Characteristics and Risks of Standardized Options.