



Hang Seng Tech trapped in the AI slow lane
Investors continue to vote with their feet in the AI race, and Hang Seng Tech isn't getting many ballots.
Share this:
- AI winners elsewhere, AI laggards in Hong Kong
- Twin breakout failures reinforce downtrend
- 4620 remains the line in the sand
The AI divide
Hang Seng Tech continues to wallow near multi-year lows while tech indices across many other parts of Asia continue to go from strength to strength, with traders clearly voting on who they think is winning the AI supremacy race.
Part of the problem is that while investors remain enthusiastic about AI, the excitement is largely reserved for the picks-and-shovels. Right now, it's the chipmakers, semiconductor manufacturers and other AI infrastructure names that remain in vogue, not the platforms where the technology may eventually unlock the biggest synergies.
Bears vs 4620
Source: TradingView
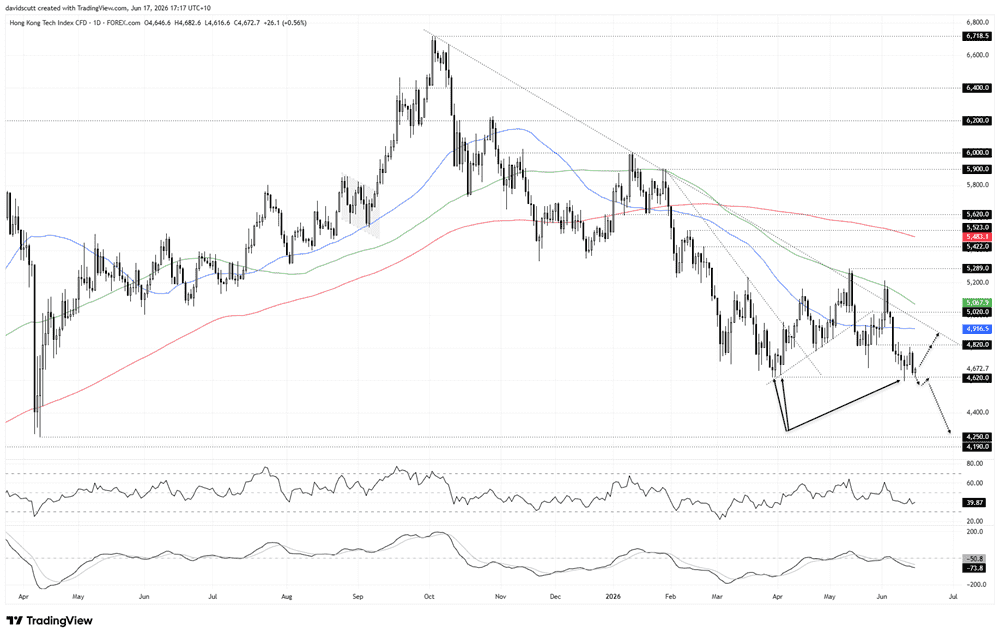
Technically, the index looks horrible, stuck in a powerful downtrend beneath each of its key medium and longer-term moving averages. And just when it looks like it will break the bearish trend, we see one almighty reversal, as seen in the twin failed breakouts earlier this year.
Yet, despite RSI (14) and MACD providing a uniformly bearish message by revealing downside momentum is continuing to build, 4620 has proven tough for bears to crack thus far. Since being established in March, it's been tested on multiple occasions, including earlier today, yet has continued to hold firm. Yes, there was one successful probe beneath it, but it was quickly jammed back higher. As such, even though price and momentum favours shorts over longs, 4620 remains the focal point for traders, allowing for setup construction on both the long and short side.
If we were to see a break and close beneath the level, there's very little support to speak of until the Liberation Day swing low of 4250, making that an obvious target. A close beneath 4620, preferably followed by a retest and rejection, would strengthen conviction in the trade, with a stop above the level protecting against reversal.
However, as the price action has shown lately, even though the downtrend overhead continues to compress the range, that doesn't eliminate the possibility of playing for countertrend bounces, as we saw last week. If the index can't crack 4620, longs could be set with a stop below for protection, targeting either resistance from 4800 up to 4820 or October downtrend found just below 5000 today. The longer the index fails to break decisively below 4620, the more it may encourage those bulls who remain to squeeze in search of a sustained breakout.
Latest market news




Open an account in minutes
Experience award-winning platforms with fast and secure execution.
Economic calendar
Web Trader platform
Our sophisticated web-based platform is packed with features.
Related articles
S&P 500, Nasdaq 100 Claw Back But NVDA Cloud Looms Overhead
Last week was green for both the Nasdaq and S&P 500 but given the sell-off that led into that bounce there’s still a very real question as to whether bears still have a statement to make. And the NVDA situation presents a very real threat.
Australian Dollar Forecast: AUD/USD Breaks Multi-Month Range, Hits 10-Month Low 11 14 2026
Aussie bears are closing in on major technical support, with next week's Australian employment data raising the stakes for a pivotal reaction.

USD/JPY Weekly Outlook: Bulls Eye Higher Range After Historic Rate Shock
A historic US rate shock has sent USD/JPY above 160, but with intervention risks rising and few major economic catalysts ahead, AI sentiment could hold the key to the next move.
The information on this web site is not targeted at the general public of any particular country. It is not intended for distribution to residents in any country where such distribution or use would contravene any local law or regulatory requirement. The information and opinions in this report are for general information use only and are not intended as an offer or solicitation with respect to the purchase or sale of any currency or CFD contract. All opinions and information contained in this report are subject to change without notice. This report has been prepared without regard to the specific investment objectives, financial situation and needs of any particular recipient. Any references to historical price movements or levels is informational based on our analysis and we do not represent or warranty that any such movements or levels are likely to reoccur in the future. While the information contained herein was obtained from sources believed to be reliable, author does not guarantee its accuracy or completeness, nor does author assume any liability for any direct, indirect or consequential loss that may result from the reliance by any person upon any such information or opinions.
Futures, Options on Futures, Foreign Exchange and other leveraged products involves significant risk of loss and is not suitable for all investors. Losses can exceed your deposits. Increasing leverage increases risk. Spot Gold and Silver contracts are not subject to regulation under the U.S. Commodity Exchange Act. Contracts for Difference (CFDs) are not available for US residents. Before deciding to trade forex, commodity futures, or digital assets, you should carefully consider your financial objectives, level of experience and risk appetite. Any opinions, news, research, analyses, prices or other information contained herein is intended as general information about the subject matter covered and is provided with the understanding that we do not provide any investment, legal, or tax advice. You should consult with appropriate counsel or other advisors on all investment, legal, or tax matters. References to FOREX.com or GAIN Capital refer to StoneX Group Inc. and its subsidiaries. Please read Characteristics and Risks of Standardized Options.