The KOSPI's sharp selloff has become a key barometer for global technology sentiment, given South Korea's central role in the AI semiconductor supply chain through Samsung Electronics and SK Hynix. Now more than 30% below its record high, the index has been hit by a broad unwind in AI-related stocks, concerns over the outlook for chip demand, and a surprise rate hike from the Bank of Korea
The weakness has spilled over into regional equity markets, with the Nikkei 225 proving more sensitive to the semiconductor-led selloff than the Nasdaq in recent weeks. Wall Street indices have also come under pressure as earnings season gets underway. Against that backdrop, the KOSPI is attempting to hold a key technical support level. Whether buyers can defend it or bears force a decisive break lower, could prove pivotal for technology sentiment and broader equity markets.
View related analysis:
- Nasdaq 100 Signals Deeper Pullback, Chipmakers Lead Selloff into Earnings
- US Dollar Bulls Lose Momentum, Commodity FX Defies Positioning | COT Report
- Canadian Dollar Slides as Soft CPI and Trump Tariffs Lift USD/CAD
- Australian Dollar Outlook: AUD/USD Bulls Hold the Edge Ahead of Jobs Data
KOSPI Tests Major Support After Sharp Selloff
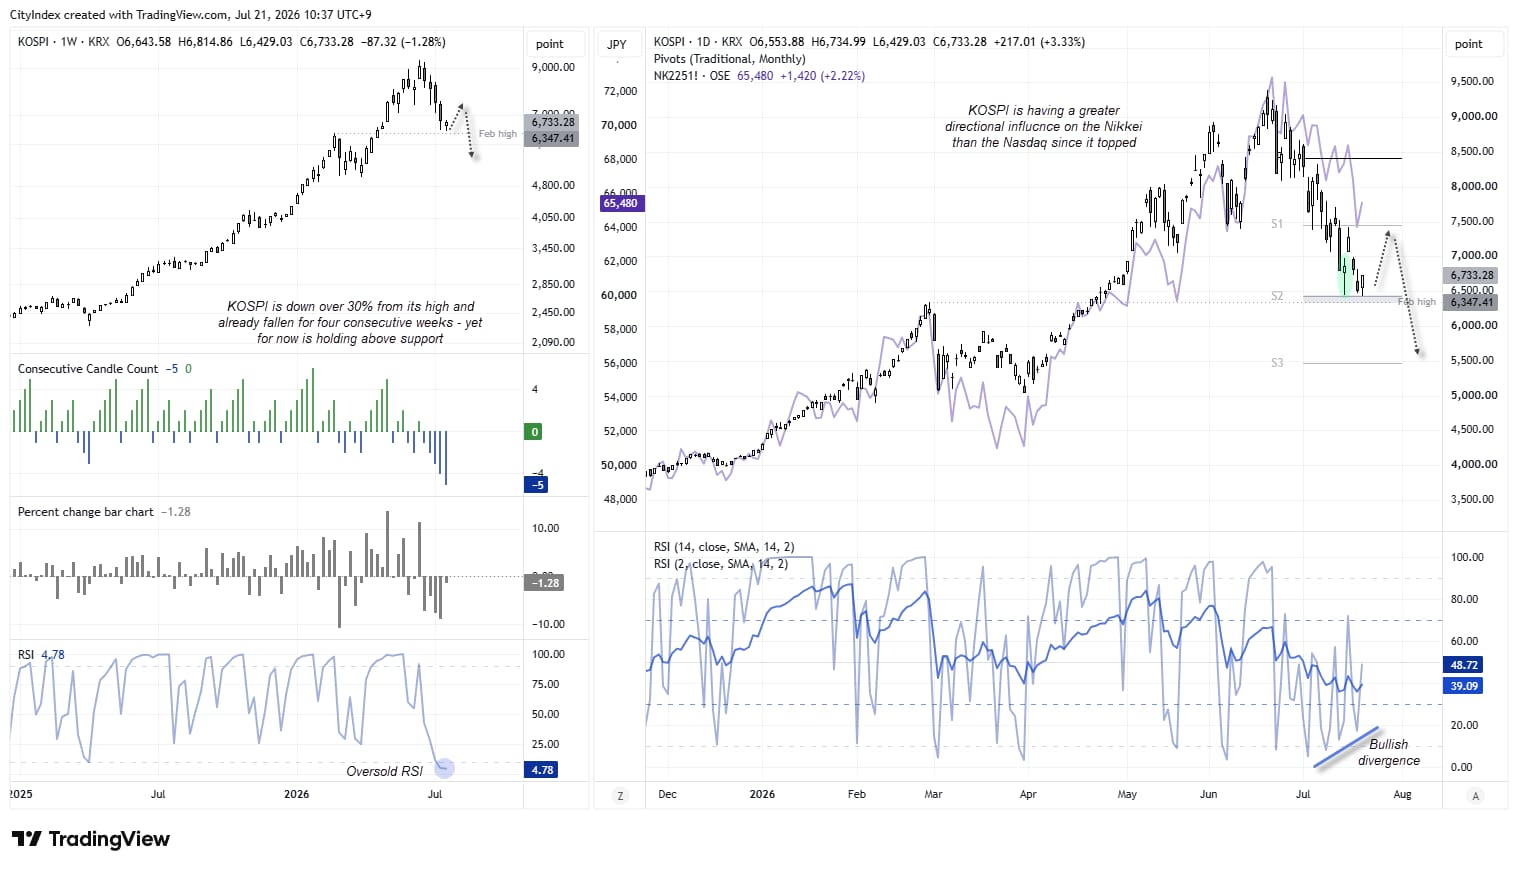
The weekly chart shows the KOSPI has fallen for four consecutive weeks and is on track for a fifth. It has not recorded a five-week losing streak since August 2024, with bearish runs typically ending after two to three weeks over the past couple of years. With the RSI (2) deeply oversold and prices holding above the February high, dip buyers may be waiting in the wings.
The daily chart shows a bullish divergence on the RSI (2), while prices continue to hold above last week's bullish pinbar low. Buyers have also stepped in today to lift the KOSPI back above 6,500.
Source: KRK, TradingView

Nasdaq 100 Futures (NQ) Technical Analysis
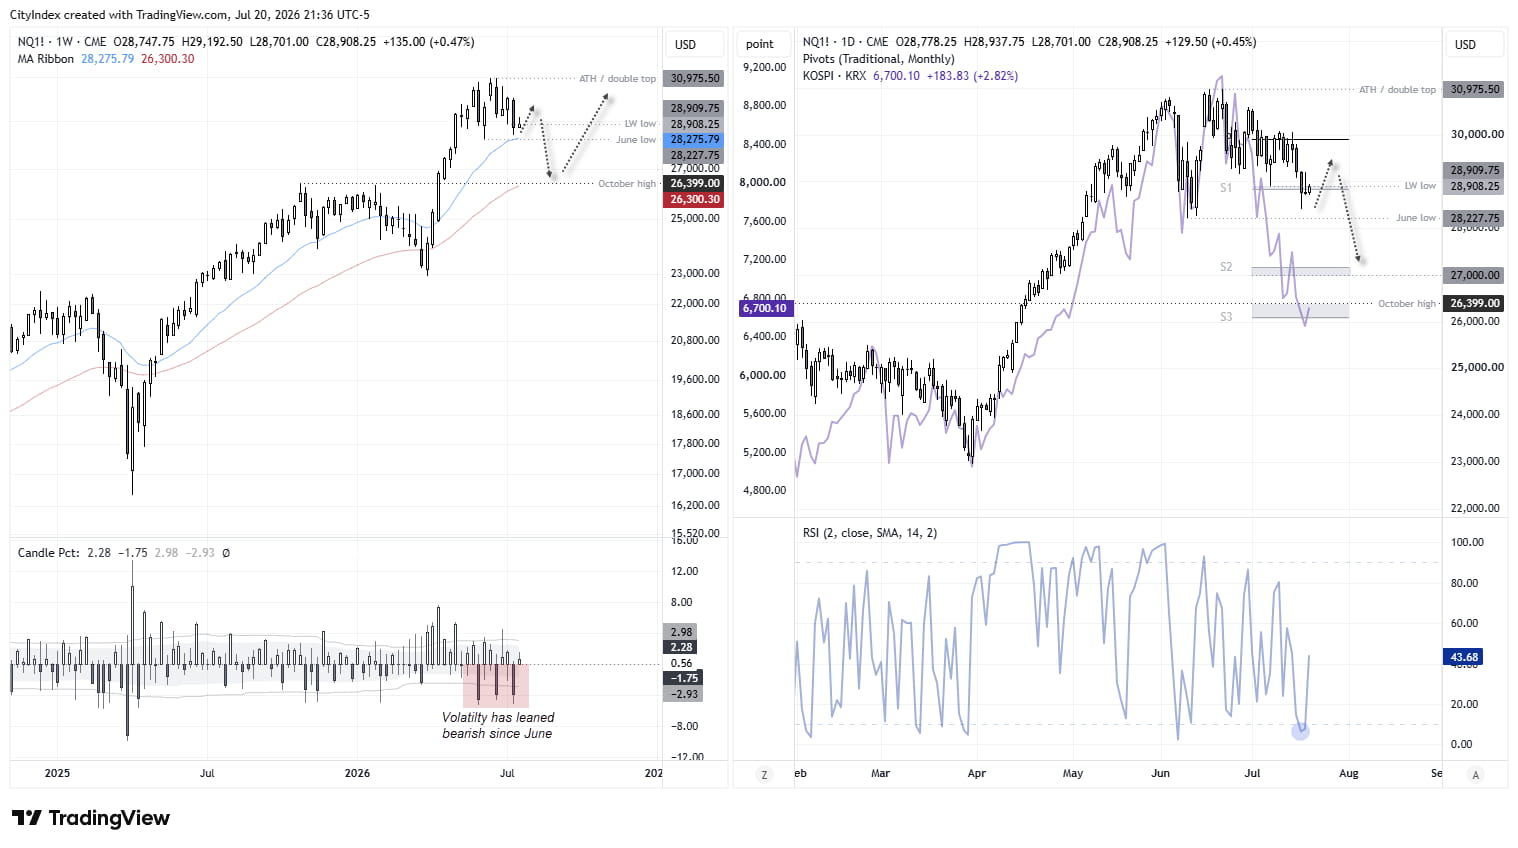
The weekly chart shows prices remain in the lower half of last week's bearish candle. Notice that volatility has favoured bears since June, with the three largest candle bodies all to the downside at around 4%. The June low (28,227) is a key support level for bears to monitor, as a break beneath it would also see prices slip below the 20-week EMA and suggest a deeper correction is underway. The next major support level is the October high (26,399), although the monthly S2 pivot point near the 27,000 handle could provide interim support if a deeper pullback unfolds.
Volatility has favoured bears since June, with the three largest weekly candle bodies all to the downside at around 4%. While the Nasdaq's pullback has been far less severe, whether prices retest the June low or rebound from current levels may ultimately depend on whether KOSPI bulls can defend their own key support level.
Source: CME, TradingView
Nasdaq 100 intraday Levels
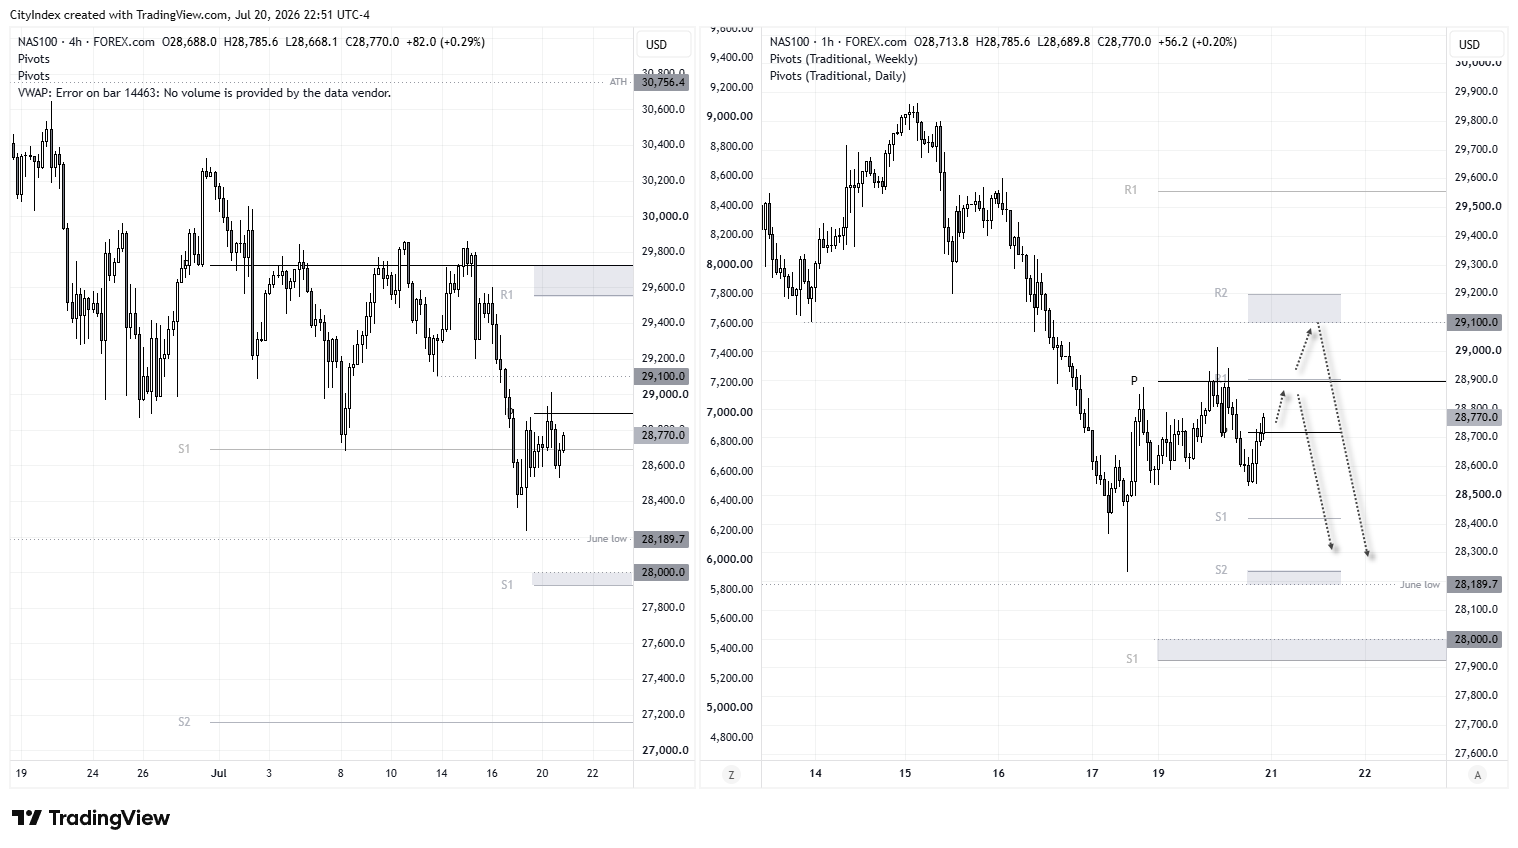
Momentum has been moving predominantly lower on the 4-hour chart, although prices are grinding higher as part of a countertrend move. If the Nasdaq breaks above its weekly pivot point and the daily R1 near 28,900, the 29,100 low and weekly R2 pivot come into view. This could provide a potential resistance zone for bears to fade into or look for evidence of a swing high, on the assumption another leg lower unfolds. The June low could then come back into focus, with a break below it suggesting a deeper pullback is underway.
Risks to my downside bias include stronger-than-expected earnings and a solid rebound in the KOSPI.
Source: Forex.com, TradingView
View the full economic calendar
-- Written by Matt Simpson
Follow Matt on Twitter @cLeverEdge