

Fundamentals are not a perfect push point for price. Sure, they can have sway, but in a true market environment, the lowest common denominator of price moves is actual buying and selling – supply and demand.
To be sure there will often be some form of relationship between the two – where headlines and fundamentals spur demand which pushes prices higher, and this can be such a common occurrence that many traders can delude themselves into thinking that there’s some inherent edge in following fundamentals. But the reality is it’s far from perfect and for the trader that’s been around long enough to have seen several cases of divergence, when bullish headlines don’t lead to fresh highs or when sour headlines don’t drive fresh lows, it’s enough to search elsewhere for motivation behind trading strategies and ideas.
In the Nasdaq 100 there’s actually a few cases of that, on either side, over the past six months, and this illustrates well not only the failure of fundamentals to have a direct and logical impact on price, but the futility in expecting the headlines to make sense.
For the current scenario, Nasdaq 100 futures are up almost 15% from the low of just three weeks ago, and price is fast approaching an important line in the sand at 26,349-26,399, which has stalled price twice over the past six months.
Will the third time at that zone be the charm for bulls?
Nasdaq 100 Futures – Weekly Price Chart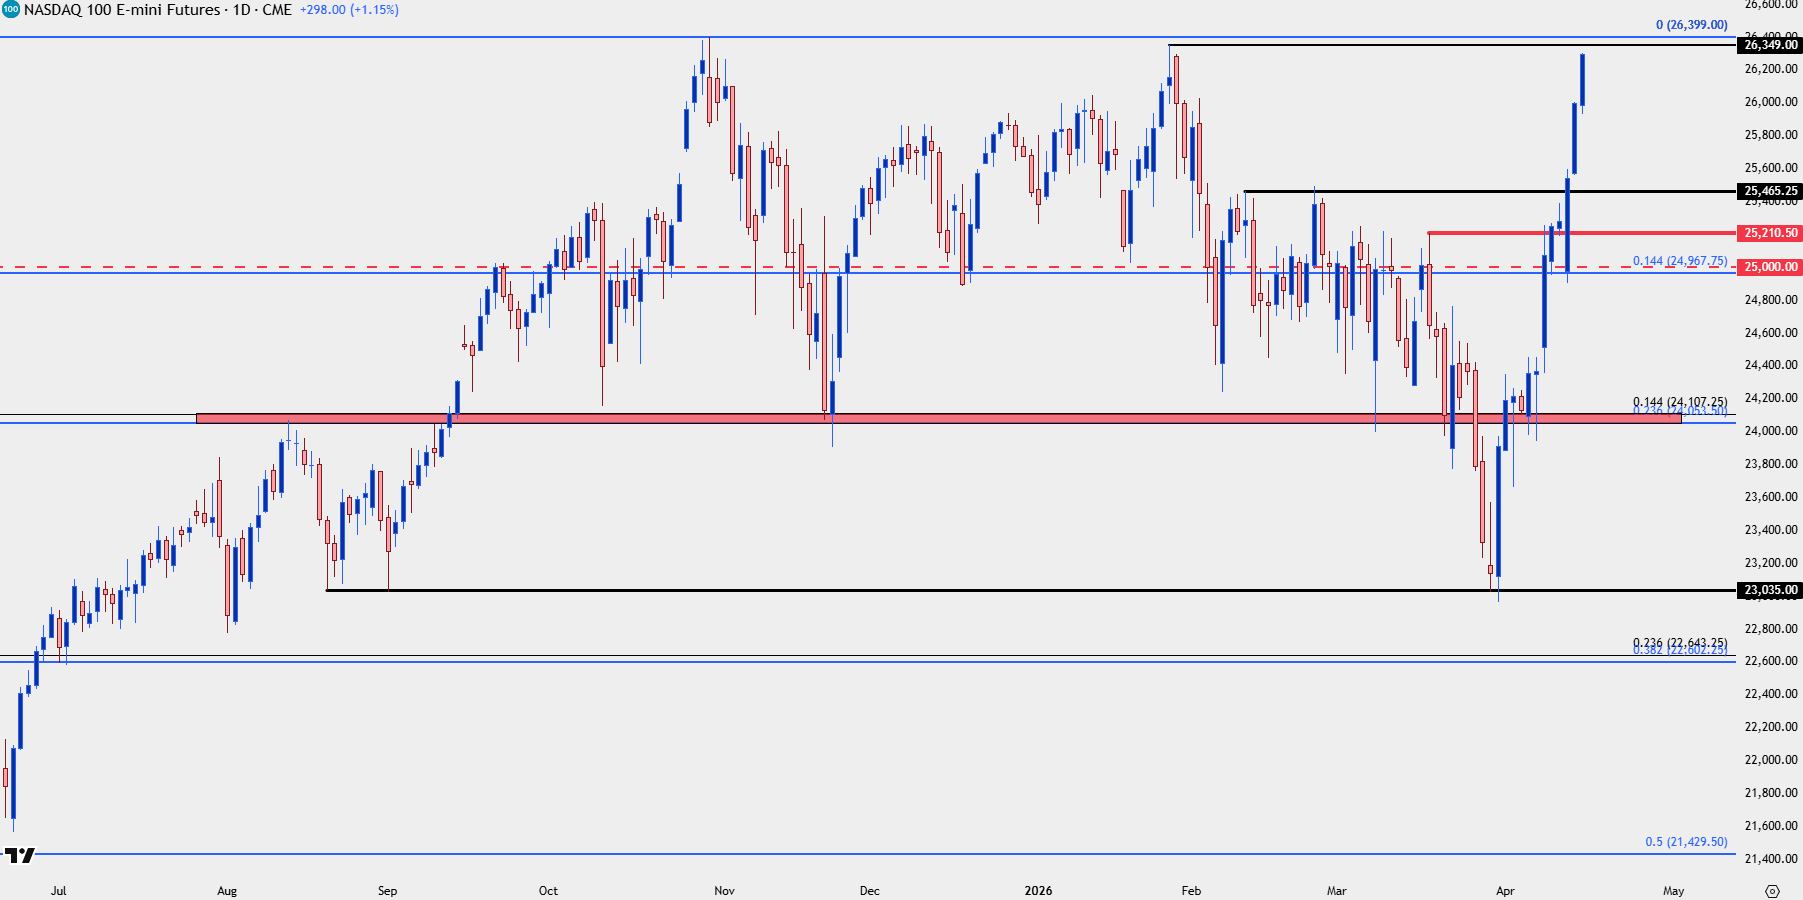
Chart prepared by James Stanley; data derived from Tradingview
The Nasdaq High
As we came into Q4 of last year stocks were ripping, backed by FOMC rate cuts and the prospect of continuation with a strong earnings backdrop to go along with soft monetary policy. But, in October, Powell didn’t sound so sure about a December rate cut and quickly stocks pulled back.
Even though the Fed did ultimately cut in December, the Nasdaq 100 was never able to re-claim the ATH, instead holding a lower-high in January just before another pullback began which hastened in March as fear around the Straight or Hormuz began to take over.
What is notable about that event, however, is how well the Nasdaq held up on a relative basis as buyers were using that pullback to take on exposure in names that were previously at stratospheric levels, such as NVDA.
And through it all, the pullback in NVDA remained rather light as the stock only retraced 23.6% of the 1862% rally that started from the 2022 lows. From the four-hour chart, we can see that initial bounce morphing into a strong case of FOMO as buyers have piled in with a fear of missing out.
Nasdaq 100 Four-Hour Chart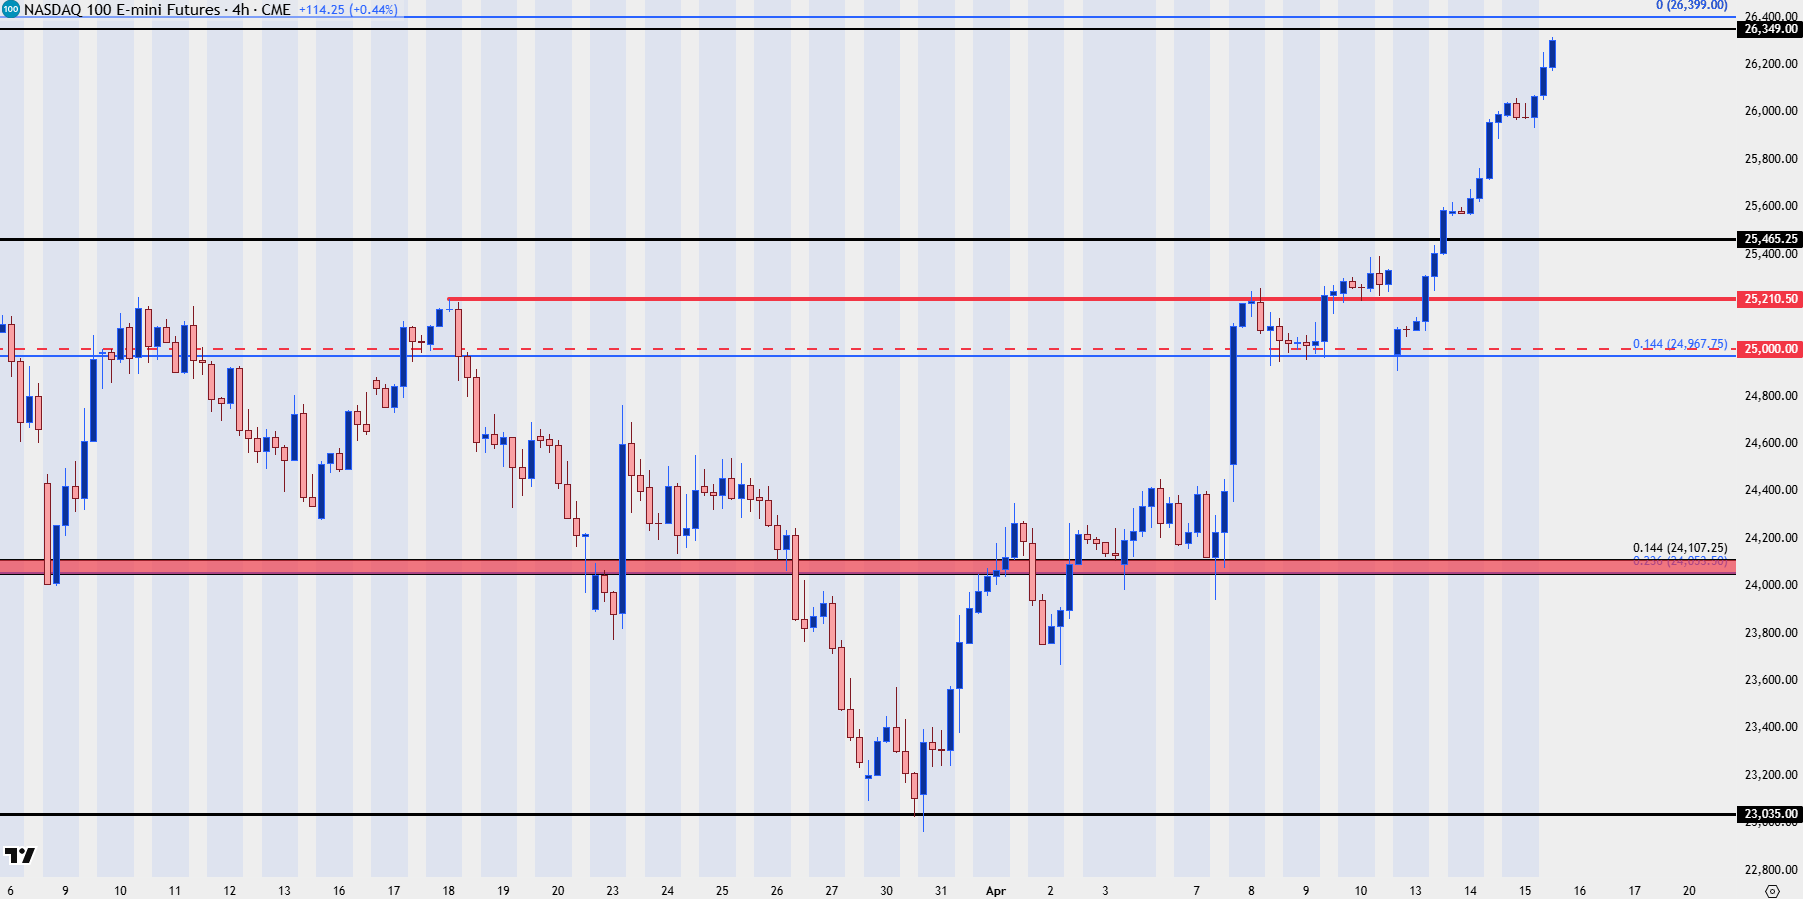
Chart prepared by James Stanley; data derived from Tradingview
--- written by James Stanley, Senior Market Analyst, Global Macro