


Nasdaq Leads Wall Street Lower: Tesla Turns, Apple Sours
Wall Street slumped as delayed NFP data hit sentiment, the Nasdaq reversed sharply, and bearish signals emerged in Tesla and Apple.
Share this:
Wall Street weakened sharply on Thursday as delayed NFP data reignited volatility and the Nasdaq led indices lower. Mega-cap tech names added fuel to the slide, with bearish signals now emerging across Tesla and Apple — raising the stakes for markets already on edge.
View related analysis:
View related analysis:
Nasdaq Leads Wall Street Lower as Tesla Turns and Apple Sours
Delayed NFP Release Triggers Volatility
Wall Street had a volatile jolt on Thursday following the delayed release of September’s Nonfarm Payrolls (NFP) figures. While the rise in unemployment to 4.4% added an element of weakness overall, the 119k jobs added — alongside a higher participation rate — was enough to convince traders there’s no immediate need for the Fed to cut. This comes on top of the latest FOMC minutes, which effectively confirmed no December cut is coming.
Nvidia Earnings Bounce Fades as Nasdaq Leads the Selloff
Nasdaq 100 futures again led the S&P 500 and Dow Jones lower, despite initially gapping higher after strong Nvidia (NVDA) earnings released after Wednesday’s close. It marked the most bearish day on Wall Street in six weeks and the Nasdaq’s most volatile session since Trump’s tariffs fractured sentiment in April.
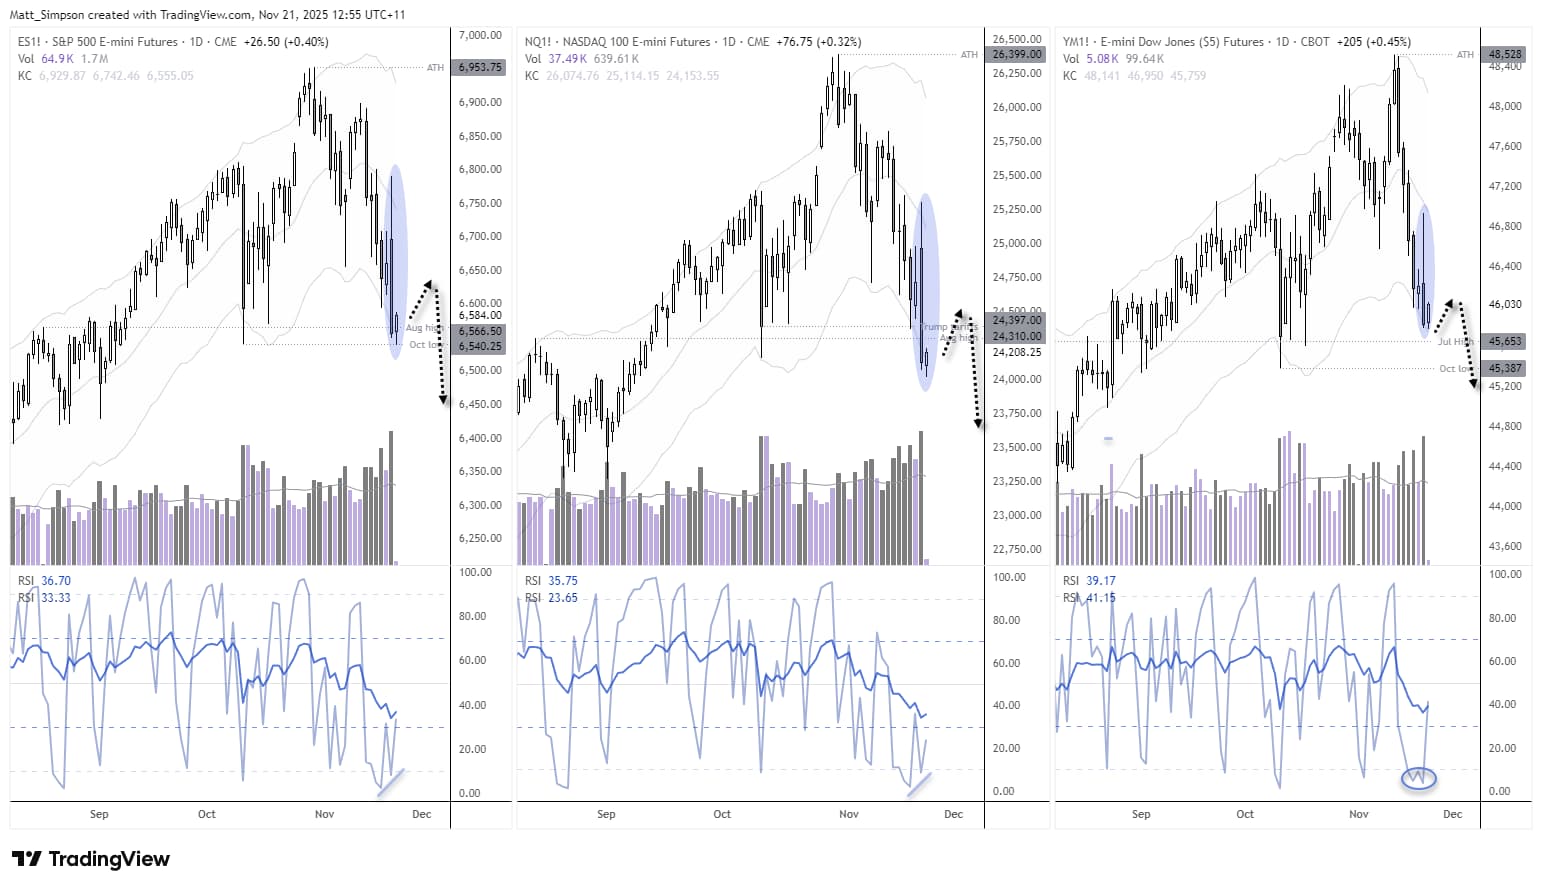
Chart analysis by Matt Simpson - data source: TradingView
- S&P 500 futures fell -1.6% and formed a prominent bearish engulfing day, though they held above the October low for now.
- Nasdaq 100 futures fell -2.6%, closed beneath the bearish candle formed when Trump recently threatened to raise tariffs on China again, and also finished below the October low.
- Dow Jones futures were again the relative outperformer, falling -0.8% but holding above both the July high and October low.
- This keeps the same dynamic in play: the Dow tends to outperform on up days, while the Nasdaq leads the downside moves.


Volumes Point to Bearish Initiation Despite Oversold Readings
Trading volumes have been trending higher across all three Wall Street indices, signalling bearish initiation and suggesting further losses may be ahead. With that said, all three indices have daily RSI (2) in oversold territory or forming bullish divergence while prices sit just beneath the lower Keltner band — so a bounce wouldn’t be surprising. The core bias, though, remains for bears to fade into any minor rallies and aim lower.
Nasdaq 100 Futures Technical Analysis: Trend Weakens After Three-Week Decline
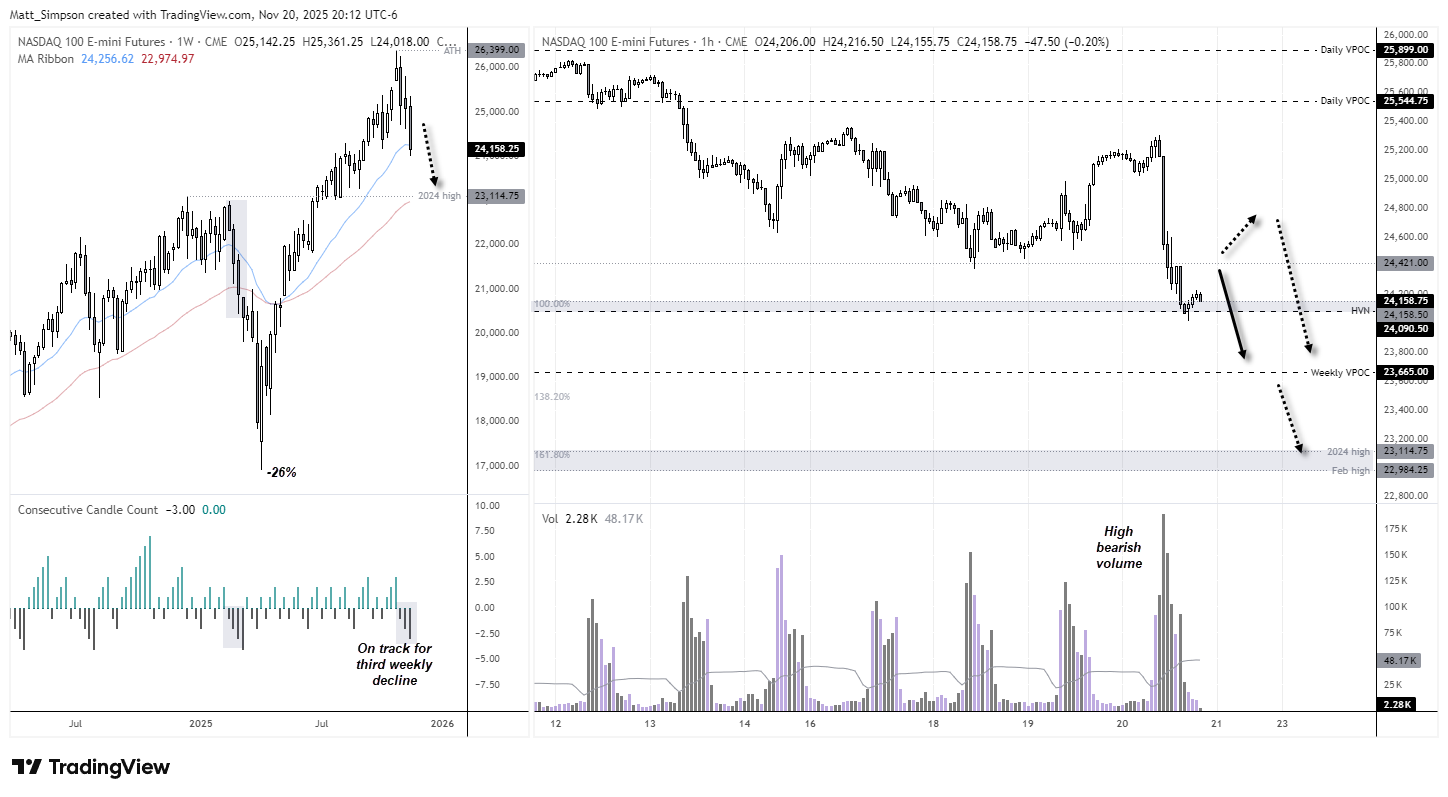
The US tech sector is on track for a third straight weekly decline. The Nasdaq hasn’t seen a bearish weekly sequence like this since February, when the index went on to fall -26% from the February high that marked the start of that selloff.
For context, the Nasdaq is currently -9% off its record high. A repeat of a -26% decline from the peak would take it below 20,000. I’m not that bearish at this stage, but a move towards its 2024 high at 23,114 — near the 50-week EMA — looks feasible.
The 1-hour chart shows support has formed around the 24,090 high-volume node and the 100% projection level. Prices are trying to rise, but volumes are thin — in stark contrast to the heavy bearish volumes during the decline. That makes any bounce without a meaningful bullish catalyst questionable, and likely something bears will look to fade.
Charts prepared by Matt Simpson, Source: TradingView
Tesla (TSLA) Technical Analysis: Bearish Momentum Hints at Swing HIgh
A double top formed around 470 on the weekly chart, which itself was a lower high relative to its record set in December. Momentum has clearly turned lower after a bearish divergence formed on the weekly RSI (14).
The daily chart shows a bearish engulfing day formed on high volume which strongly hints at a swing high. That the engulfing candle failed to retest the high-volume node (HVN) of the prior congestion area, and reversed back beneath the monthly S1 pivot, adds to my bearish conviction on this timeframe.
The May high (367.7) and 200-day EMA (359.29) are now in focus for bears, a break beneath which brings the HVN ~320 into focus.

Chart analysis by Matt Simpson - data source: NYSE, TradingView


Apple (AAPL) Technical Analysis: Momentum Weakens After Rejection at 272
Apple’s decision to scale back AI investment has helped its share price hold up far better than other mega-cap tech stocks during the recent AI rout. That’s why early signs of momentum turning lower in Apple deserve attention.
The weekly chart shows repeated upper wicks above 272, signalling a clear lack of buying strength at those highs. A bearish divergence has also formed on the weekly RSI (2), even though the RSI (14) hasn’t quite reached overbought.
Thursday produced a notably bearish candle that failed to retest the cycle high, suggesting momentum may now be shifting.
Apple may not be the ideal short candidate given its relative strength, but it’s absolutely one to watch — because if the wheels come off here, it likely means far heavier selling elsewhere.
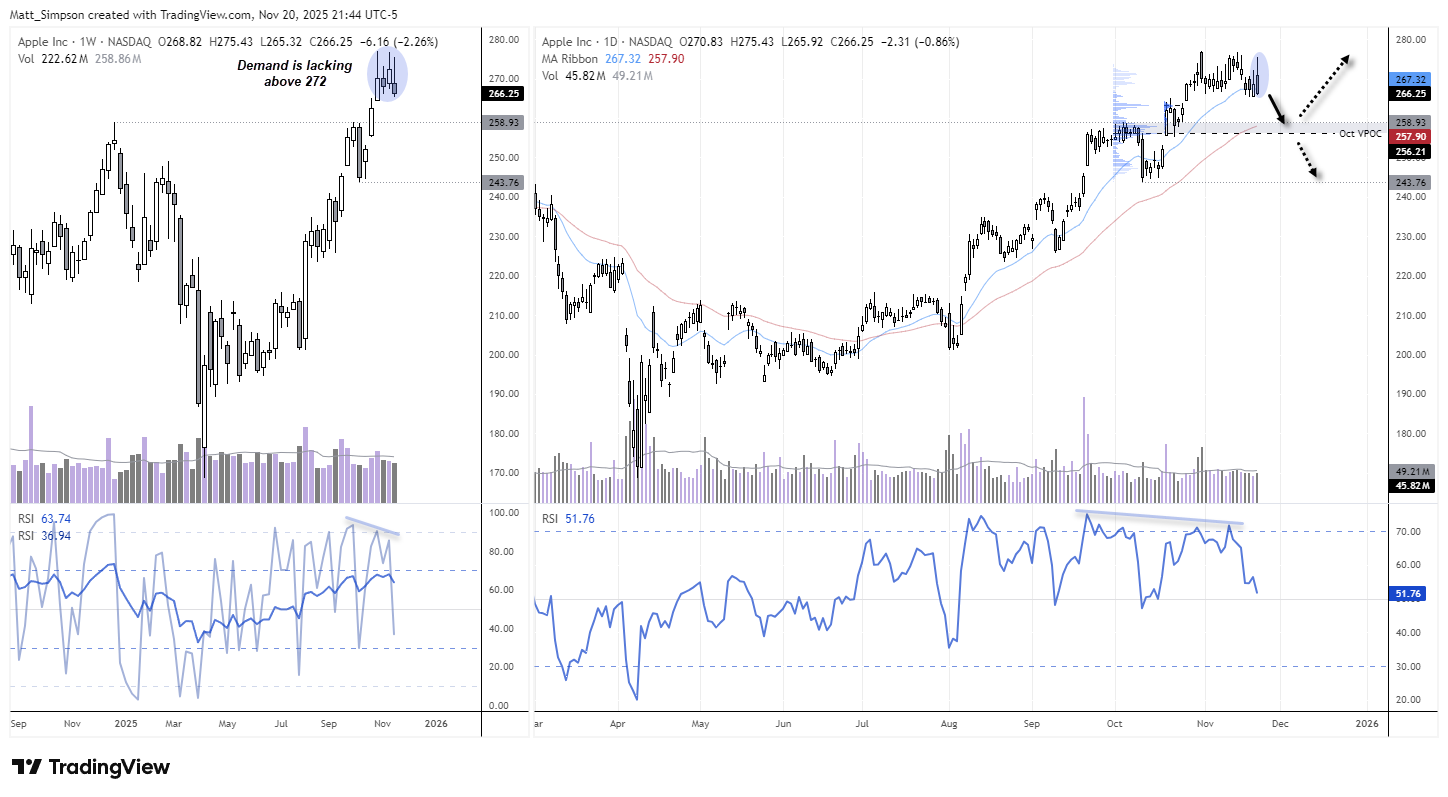
Chart analysis by Matt Simpson - data source: TradingView
View the full economic calendar
View the full economic calendar
-- Written by Matt Simpson
Follow Matt on Twitter @cLeverEdge
How to trade with City Index
You can trade with City Index by following these four easy steps:
- Open an account, or log in if you’re already a customer
• Open an account in the UK
• Open an account in Australia
• Open an account in Singapore
- Search for the market you want to trade in our award-winning platform
- Choose your position and size, and your stop and limit levels
- Place the trade


Open an account in minutes
Experience award-winning platforms with fast and secure execution.
Economic calendar
Web Trader platform
Our sophisticated web-based platform is packed with features.
Related articles
Forex & Gold Outlook: Dollar Dominates, Crosses Diverge
The US dollar rally gathers momentum as forex crosses develop contrasting technical setups. Matt Simpson examines eight FX markets and gold for potential trading opportunities.

Gold Outlook: Asia Buys the Dip, US Hammers the Rip
Asia buys the dip, the US sells the rip. Hourly gold, dollar and Treasury yield data reveal a regional divide that has become especially pronounced since September.


S&P 500, Nasdaq 100 Claw Back But NVDA Cloud Looms Overhead
Last week was green for both the Nasdaq and S&P 500 but given the sell-off that led into that bounce there’s still a very real question as to whether bears still have a statement to make. And the NVDA situation presents a very real threat.

The information on this web site is not targeted at the general public of any particular country. It is not intended for distribution to residents in any country where such distribution or use would contravene any local law or regulatory requirement. The information and opinions in this report are for general information use only and are not intended as an offer or solicitation with respect to the purchase or sale of any currency or CFD contract. All opinions and information contained in this report are subject to change without notice. This report has been prepared without regard to the specific investment objectives, financial situation and needs of any particular recipient. Any references to historical price movements or levels is informational based on our analysis and we do not represent or warranty that any such movements or levels are likely to reoccur in the future. While the information contained herein was obtained from sources believed to be reliable, author does not guarantee its accuracy or completeness, nor does author assume any liability for any direct, indirect or consequential loss that may result from the reliance by any person upon any such information or opinions.
Futures, Options on Futures, Foreign Exchange and other leveraged products involves significant risk of loss and is not suitable for all investors. Losses can exceed your deposits. Increasing leverage increases risk. Spot Gold and Silver contracts are not subject to regulation under the U.S. Commodity Exchange Act. Contracts for Difference (CFDs) are not available for US residents. Before deciding to trade forex, commodity futures, or digital assets, you should carefully consider your financial objectives, level of experience and risk appetite. Any opinions, news, research, analyses, prices or other information contained herein is intended as general information about the subject matter covered and is provided with the understanding that we do not provide any investment, legal, or tax advice. You should consult with appropriate counsel or other advisors on all investment, legal, or tax matters. References to FOREX.com or GAIN Capital refer to StoneX Group Inc. and its subsidiaries. Please read Characteristics and Risks of Standardized Options.