


NFP Key Points
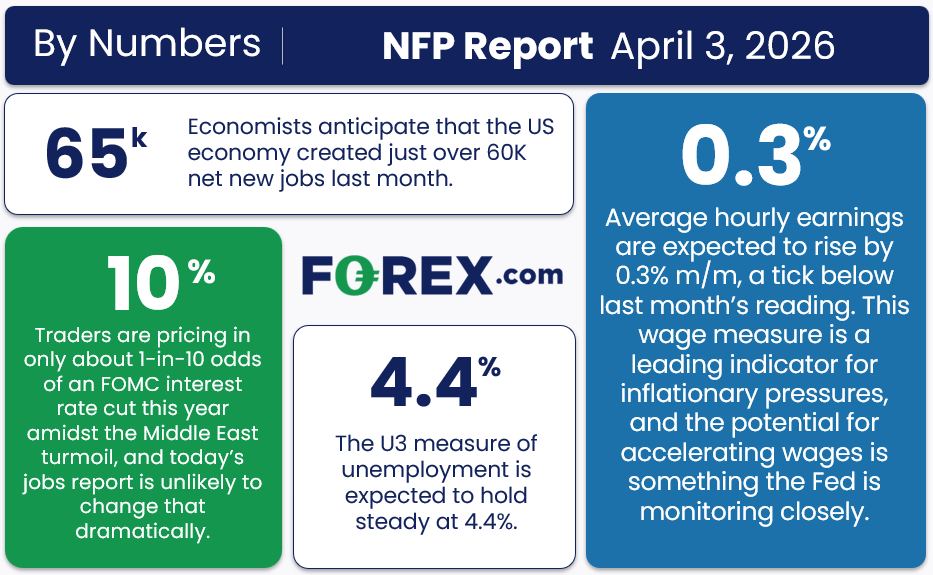
- NFP report expectations: +65K jobs, +0.3% m/m earnings, unemployment at 4.4%.
- NFP leading indicators point to a potentially above-expected reading in this month’s NFP report, with headline job growth potentially coming in somewhere in the 100-140K range.
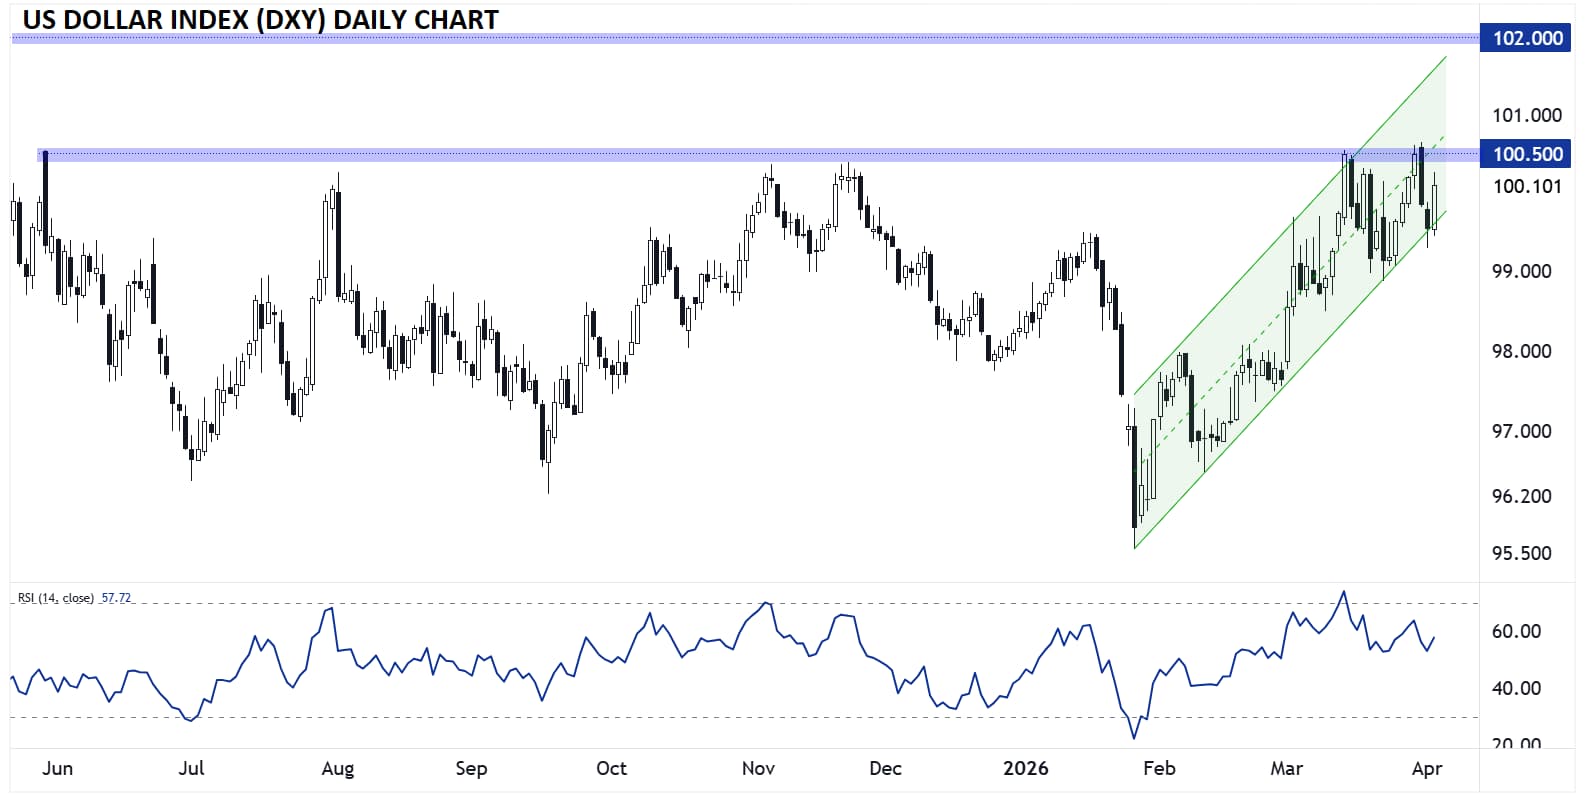
- The US Dollar Index is testing stout resistance at 100.50, but traders will likely remain keen to buy any dips as long as there’s no definitive signs of a move toward peace in Iran.
When is the March NFP Report?
The March NFP report will be released on Friday, April 3, at 8:30 ET.
NFP Report Expectations
Traders and economists expect the NFP report to show that the US created 65K net new jobs, with average hourly earnings rising 0.3% m/m (3.8% y/y) and the U3 unemployment rate at 4.4%.
NFP Overview
After President Trump’s fiery primetime address to the nation last night, traders are pricing in the potential for a prolonged conflict in Iran, and more importantly, an extended closure of the Strait of Hormuz. Against this backdrop, markets will remain focused first and foremosst on developments in the Middle East over any economic data, even top-tier reports like the US Non-Farm Payrolls (NFP).
That said, readers should still monitor the jobs market in the US as a driver of monetary and fiscal policy. Last month’s reading came in well below expectations, showing a drop of -92K jobs and increase in the unemployment rate, though some analysts believe it was driven by one-off factors that could reverse this month.
In any event, traders are expecting an extension of the “low hire, low fire” regime that has characterized the past year or so in this month’s jobs report:
Source: StoneX
As the graphic above shows, traders are essentially anticipating a “return to normal” jobs report, with modest job growth, stable unemployment, and continued gradual wage increases.
Combined with accelerating inflation above the Federal Reserve’s 2% target, traders have essentially priced out any additional interest rate cuts from the Federal Reserve this year, with the CME’s FedWatch tool showing an 80% probability of no changes to interest rates at all this year:
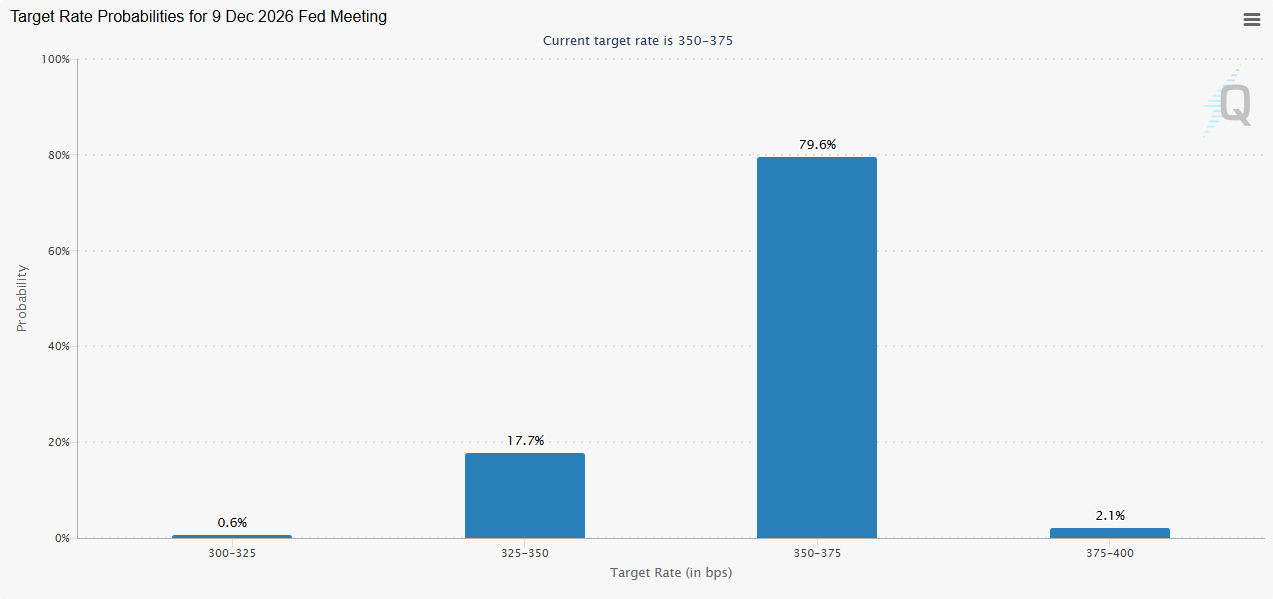
Source: CME FedWatch
Clearly, traders are coming to the conclusion that even when Kevin Warsh, Trump’s nominee for the next Federal Reserve Chairman, comes aboard, the case for additional interest rate cuts will be an uphill battle any time soon.
NFP Forecast
As regular readers know, we focus on four historically reliable leading indicators to help handicap each NFP report, but given the vagaries of the calendar this month, the ISM Services PMI report won’t be released until Monday:
- The ISM Manufacturing Employment subindex held steady at 48.7 from 48.8 last month.
- The ADP Employment report came in at 62K jobs, also essentially unchanged from last month’s 62K reading.
- The 4-week moving average of initial unemployment claims fell to 208K, down from 220K last month to historically low levels.
Weighing the data and our internal models, the leading indicators point to a potentially above-expected reading in this month’s NFP report, with headline job growth potentially coming in somewhere in the 100-140K range, albeit with a big band of uncertainty given the limited response rates.
Regardless, the month-to-month fluctuations in this report are notoriously difficult to predict, so we wouldn’t put too much stock into any forecasts (including ours). As always, the other aspects of the release, including the closely-watched average hourly earnings figure and unemployment rate will also impact how markets react to the release.
Potential NFP Market Reaction
|
|
Wages < 0.2% m/m |
Wages 0.2-0.4% m/m |
Wages > 0.4% m/m |
|
< 20K jobs |
Slightly Bearish USD |
Slightly Bearish USD |
Neutral USD |
|
20-110K jobs |
Neutral USD |
Neutral USD |
Neutral USD |
|
> 110K jobs |
Neutral USD |
Slightly Bullish USD |
Bullish USD |
Technically speaking, the US dollar is trading near the top of its 10-month range against its major rivals amid continued safe haven demand, and unless we see progress toward opening the Strait of Hormuz, any dips may be short-lived.
US Dollar Index Technical Analysis – DXY Daily Chart
Source: TradingView, StoneX
As the chart above shows, the US Dollar Index (DXY), which measures the performance of the US dollar against a basket of its largest rivals, continues to rise within a bullish channel to approach a 10-month high near 100.50. That resistance level remains a stout barrier, having capped prices on six occasions since last May, but as any experienced technical analyst will tell you, the more a resistance level is tested, the more likely it is to break.
If we do see a confirmed break above the 100.50 area, either on the back of a strong jobs report or continued escalation in the Middle East, the next level to watch will be at the 1-year high up around 102.00. Meanwhile, a particularly weak jobs report or signs of a potential ceasefire in Iran could break the bullish channel, setting the stage for a pullback toward 99.00 or 98.00 later this month, though that remains a lower probability scenario at this point.
-- Written by Matt Weller, Global Head of Research
Follow Matt on Twitter: @MWellerFX






