
- Nikkei's Friday plunge ranks 29th worst since 1949
- Realised volatility elevated across multiple time frames
- Oversold conditions historically favour short-term rebounds
- Historical drawdowns warn of further downside risk
The Nikkei 225 has broken through key technical levels, closing at its lowest level since April after suffering one of the largest single-session declines in its 77-year history.
While the index is now heavily oversold, with similar conditions historically tending to produce modest short-term rebounds, analysis of forward returns suggests traders should be wary of assuming the worst is over. Previous episodes have frequently seen further substantial selling beyond the initial decline, raising the risk that any near-term recovery proves short-lived.
Nikkei rout ranks among the worst in 77 years
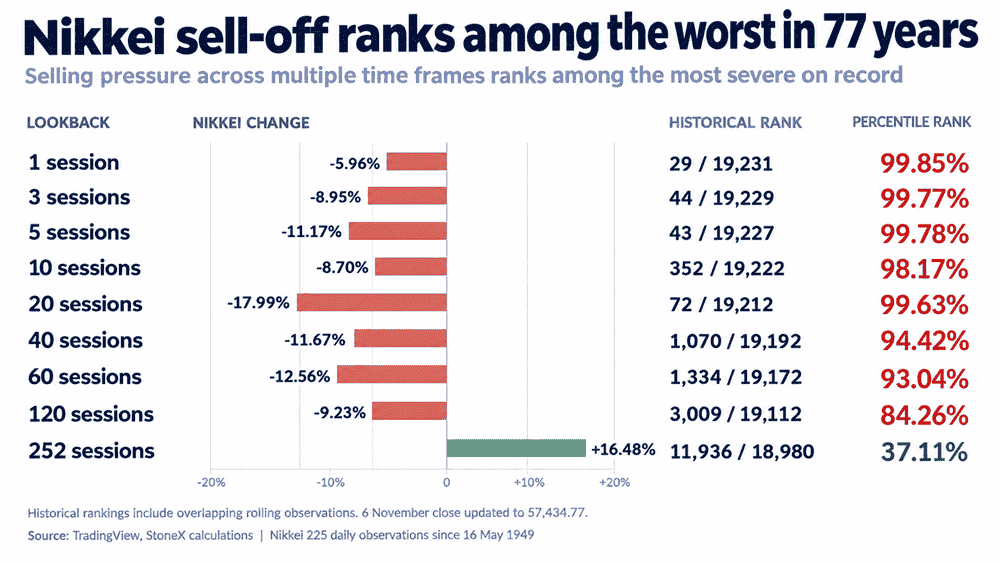
Friday's 5.96% plunge ranks as the 29th-largest one-session decline in Nikkei 225 history, based on daily observations stretching back to May 1949, extending what has already been a difficult period for bulls over recent months.
Source: TradingView
The index has now shed 11.17% over the past five sessions, the 43rd-worst performance in more than 19,000 rolling observations. Over 20 sessions, the decline extends to 17.99%, with both ranking beyond the 99th percentile for historical selling severity, underlining just how aggressively the index has been sold. It has now entered a technical bear market, falling 21.1% from its record peak of 72,831.73 reached in June.
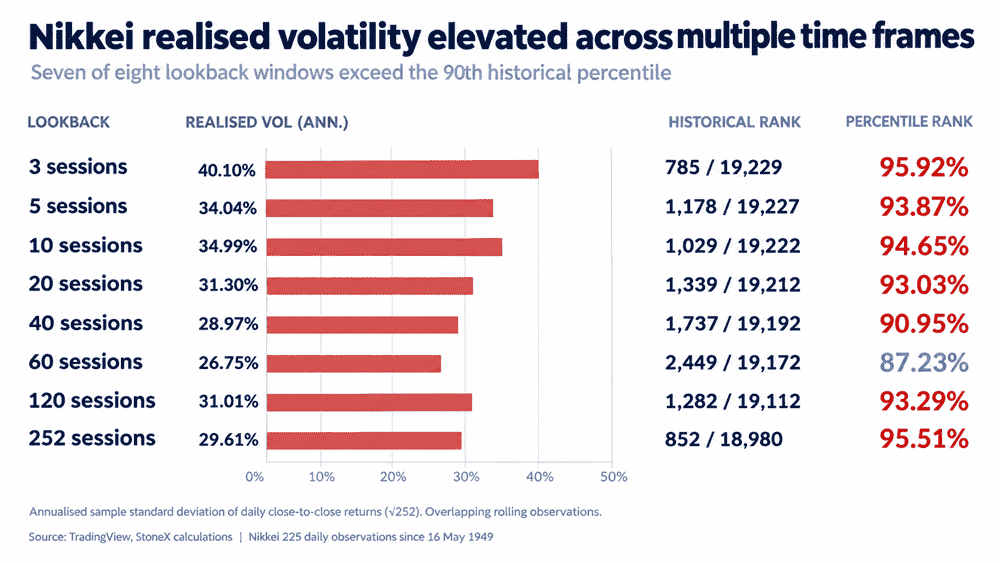
Not only have the declines been substantial, but volatility has also been extreme across multiple time frames. Annualised realised volatility exceeds the 90th historical percentile across seven of the eight periods examined, including the past 252 sessions. That suggests Japanese equities were experiencing unusually large price swings well before the latest market rout.
Source: TradingView
Squeezes from extreme oversold conditions often don’t last
After such an abrupt decline, the Nikkei 225 is now heavily oversold across multiple technical indicators. Daily RSI (14) has fallen to 25.94, placing it in the bottom 1% of observations this century, while the 50-day moving-average stretch indicator, normalised by ATR (14), has declined to −3.01, also a relatively extreme reading.
Looking at previous occasions when both indicators were at least as depressed, historical analysis points to a strong tendency for an immediate rebound. Grouping nearby signals into individual selling episodes produces 28 comparable observations since 1999. Of those, 78.6% delivered positive returns the following session, with an average gain of 1.07% and a median of 0.92%.
Forward returns over longer periods were far more dispersed in scale. After ten sessions, 42.9% of episodes had delivered losses, despite an average gain of 2.76%. After 20 sessions, the average return improved to 3.83%, with a median of 5.42%, although more than a third of episodes still finished lower. Even after 40 sessions, nearly one in three remained in negative territory.
While the positive returns over longer time frames appear bullish on the surface, they can conceal the substantial downside traders often faced in the interim. Over the following 20 sessions, the average maximum intraday drawdown from the initial signal was 5.18%, with a median of 3.31%. In 42.9% of episodes, the index fell at least another 5%, increasing to 50% over 40 sessions. History therefore suggests that while a short-term bounce may be on the cards, traders should be wary of assuming the worst of the selling is over.
Bears retain control
Source: TradingView
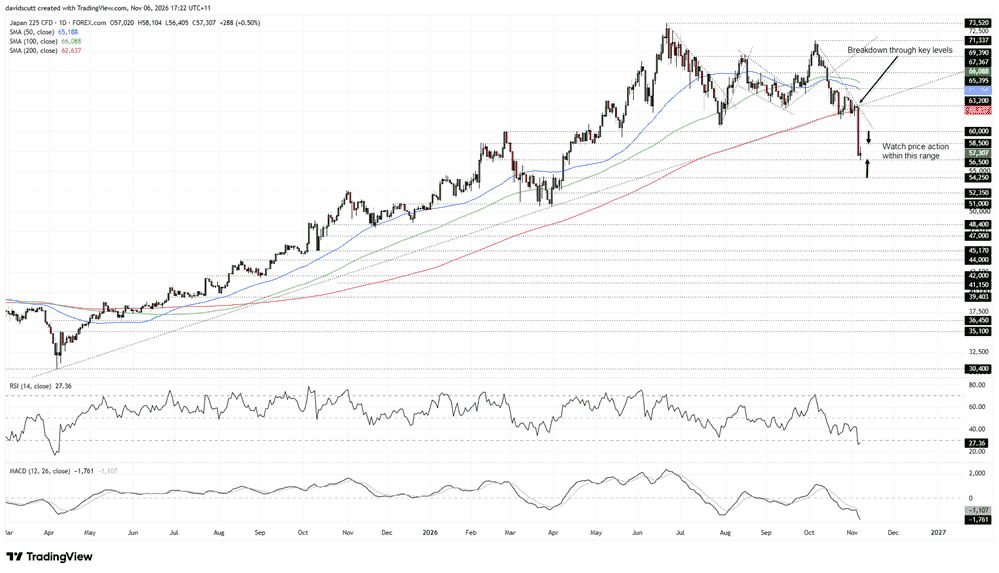
Having consistently bounced off the 200-day moving average prior to the latest breakdown, Thursday's decline in our Nikkei 225 contract saw the price break beneath the key 60,000 level, taking out 58,500 before eventually stalling at 56,500, a level that has previously acted as both support and resistance.
That now becomes the immediate focal point underneath, with 58,500 the first level to watch overhead. While historical backtesting points to a tendency for short-term rebounds from similarly oversold conditions, the broader message from the momentum indicators continues to favour downside risks.
RSI (14) has set a fresh low and moved into oversold territory, suggesting downside momentum is still building. MACD reinforces the bearish signal, having staged a bearish crossover, with the indicator moving further beneath its signal line into negative territory. That favours short setups over longs, although it doesn't discount the possibility of a near-term squeeze given how stretched conditions have become.
A break beneath 56,500, preferably followed by a backtest and rejection, would present an entry point for shorts, allowing for a tight stop above the level for protection, targeting 54,250, 52,350 and 51,000. The latter carries greater significance, having acted as both support and resistance on multiple occasions during late 2025 and early 2026.
The same approach applies to longs on a break above 58,500, preferably followed by a backtest and bounce, allowing for a tight stop beneath the level for protection. That would bring 60,000 into play initially, followed by downtrend resistance running from the October highs and the 200-day moving average.