
- Nikkei weakness contrasts with broader Japanese equity market resilience
- AI-linked heavyweights central to the recent unwind
- Earnings expectations remain positive across most Nikkei constituents
- Major technical support approaches as US tech earnings loom
Like so many other beneficiaries of the AI boom, the Nikkei 225 has stumbled over recent weeks, taking the index back towards a key technical support zone that should be on the radar of traders and investors alike.
But while the headline index looks heavy, what's happening beneath the surface tells a different story, suggesting the recent weakness is largely an unwind in AI-linked stocks rather than evidence of broader trouble across Japanese equities.
AI concentration takes its toll
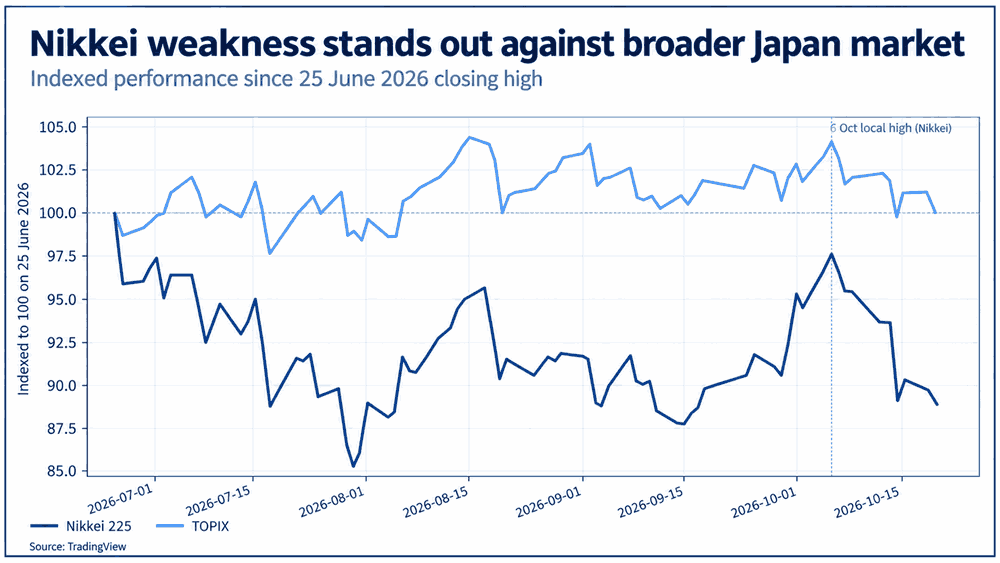
The graphic below, showing the relative performance of the Nikkei 225 and broader TOPIX index since late June, provides a strong clue as to what's been driving the recent weakness.
Source: TradingView
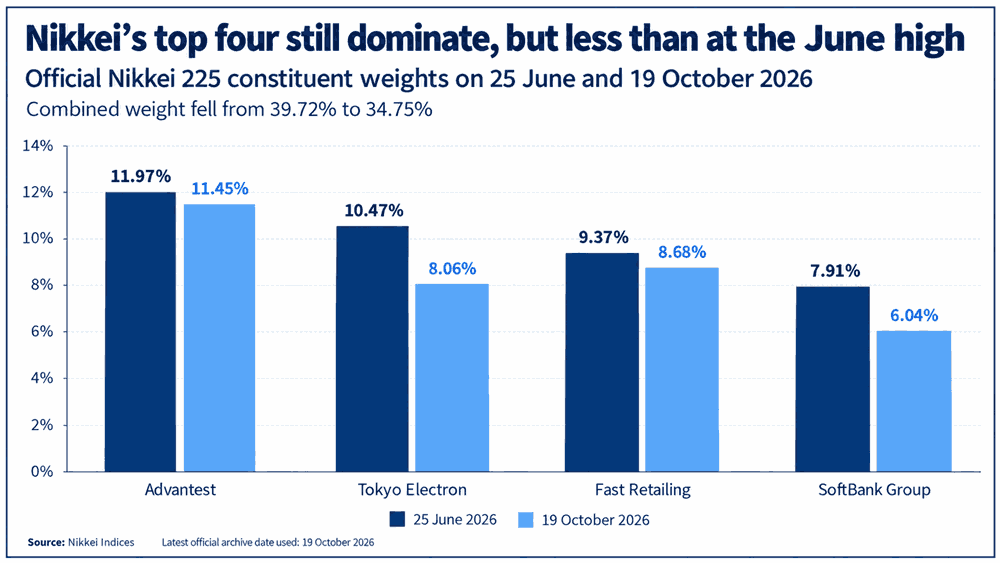
While TOPIX is weighted by market capitalisation, the Nikkei is price-weighted, giving a handful of constituents disproportionate influence over its performance. And as the next graphic shows, several of its largest constituents sit at the epicentre of the global AI trade.
At the June highs, just four companies, Advantest, Tokyo Electron, SoftBank Group and Fast Retailing, accounted for nearly 40% of the Nikkei's index weight, with the latest unwind taking that back to around 35% by mid-October. Even with that pullback, it underlines just how heavily exposed the index remains to movements in those particular names.
Source: LSEG
Of the four, three are closely tied to the global AI investment boom: Advantest through semiconductor testing equipment, Tokyo Electron through chipmaking equipment, and SoftBank Group through its investments in AI companies and infrastructure.
As has been the case with other indices heavily weighted towards AI-linked names, such as the KOSPI and Nasdaq 100, that concentration goes a long way towards explaining why the Nikkei has been wobbling recently.
Unlike previous periods of weakness in Japanese equities, there has been no strong relationship with either the Japanese yen or movements in government bond yields recently, adding to the evidence that global AI sentiment has been the more important influence on the Nikkei's performance.
Corporate profits hold up
While the Nikkei has struggled, there's little in the broader earnings outlook to suggest Japanese companies are facing stiffening macro headwinds.
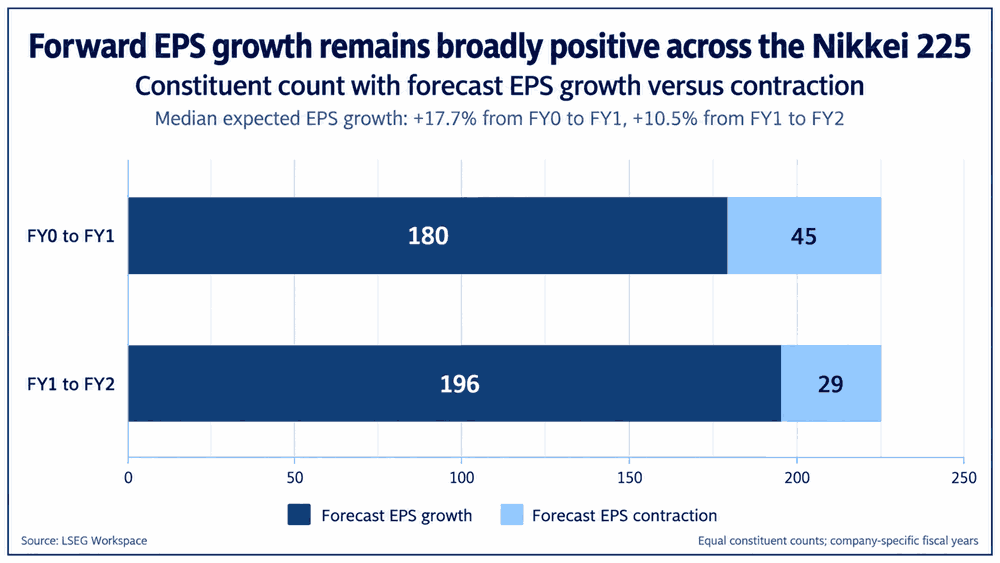
According to LSEG consensus estimates, 180 of the Nikkei's 225 constituents are expected to deliver earnings per share growth in the current fiscal year, rising to 196 companies in the following fiscal year. Median expected earnings growth stands at 17.7% and 10.5%, respectively.
Source: LSEG
And it's not just equity analysts anticipating earnings growth, with the Bank of Japan's September Tankan survey, released earlier this month, showing large manufacturers have sharply upgraded their profit expectations since June. Anticipated FY2026 growth swung from a 6.7% contraction to a 13.6% increase, providing a contrast to non-manufacturers, whose profit outlook was less upbeat.
Considering the pressures from elevated energy costs, global trade uncertainty and Japanese interest rates sitting at or near multi-decade or record highs, it's hardly a picture that points to imminent downside risks from a fundamental perspective.
Major support test approaches
Source: TradingView
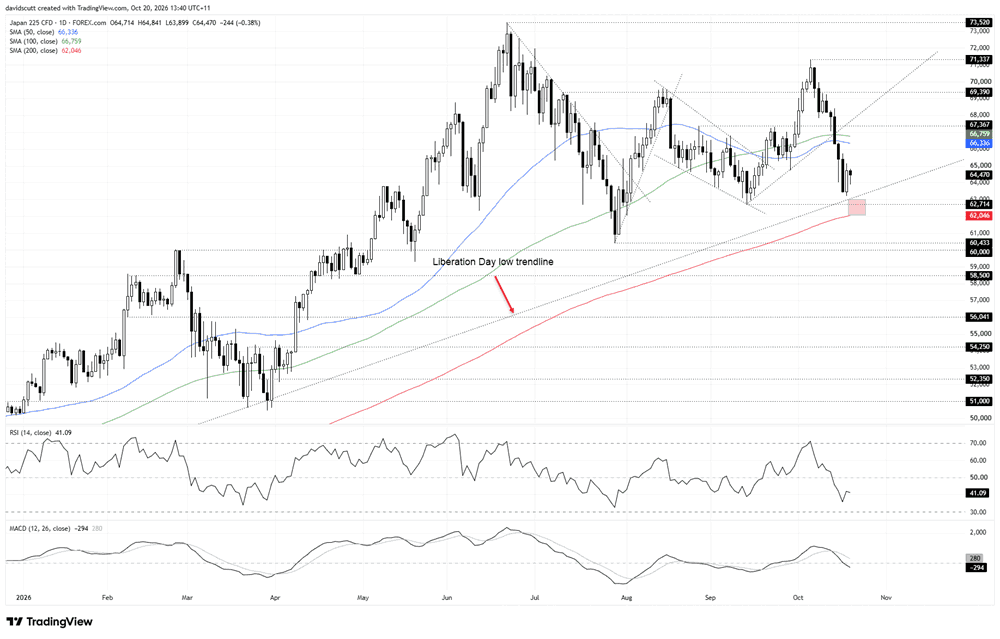
The latest unwind has broken the minor uptrend extending from the September 14 lows, taking the Nikkei beneath its 50-day and 100-day moving averages in the process.
That has seen the index pull back towards long-running uptrend support dating back to the Liberation Day lows of April 2025, along with horizontal support at 62,714, the low set on September 14. With the 200-day moving average sitting just above 62,000, the intersection of these three levels creates an important support zone for gauging the index's medium and potentially long-term directional risks.
On the upside, 65,000 is the immediate level to watch, having attracted considerable price interaction over recent months. Beyond that, 67,367 is the next level of note, having acted as resistance before the breakout that took the Nikkei back above 70,000. Further resistance is located at 69,390 and 71,337, followed by the record high of 73,520.
Should the price break and hold beneath the lower end of the support zone, marked by the 200-day moving average, it would point to growing risk of a more substantial unwind. That would bring 60,433, the July 29 low, into focus initially, followed by 60,000 and 58,500, both of which have acted as support and resistance earlier this year.
For now, the oscillators suggest downside momentum remains in place, although selling pressure has moderated over recent days. RSI (14) remains beneath the neutral 50 level, while MACD has recorded a bearish crossover and slipped into negative territory.
That creates a backdrop where momentum continues to favour bears, but the price is yet to break beneath the key support zone immediately below where the index now trades.
With major US technology earnings approaching, starting with Meta after Wednesday's close on Wall Street, the next round of results from hyperscalers spending enormous sums on AI infrastructure looms as an important test of whether the Nikkei, stacked with upstream AI picks and shovels, has further to fall.