


It was a fast sell-off to start the day and there were numerous headlines about an AI bubble on the verge of bursting. That seems presumptuous a mere 5% away from all-time-highs, but there is the prospect of change given the data releases that can now come out after the conclusion of the most recent government shutdown.
Stocks Snap Back
This webinar was a little different as the elephant in the room at the time was a slide in equities that has started to look more and more aggressive. I talked about drivers up front, highlighting the accusation of an AI bubble that’s on the verge of bursting, if it hadn’t already; and while I do think there are some bubble-like signs still showing in equities, as I had written in the 2025 forecast, I’m skeptical that it’s what’s behind the current sell-off.

The first ten minutes or so of the session was spent analyzing that and highlighting the fact that since the Fed’s last rate cut in October, it’s been lower-lows and lower-highs for SPX. That meeting, of course, is when Powell poured cold water on bulls’ hopes for another cut in December, with odds for that move now showing at a coin flip. But when we go out to next year, expectations are still wide for another 75 bps of cuts by the end of the year and this highlights the fact that markets aren’t expecting the Fed to pull the rug out from global markets.
Instead, this seems to be more of a squaring up dynamic ahead of the release of NFP data, going along with a really important earnings report from NVDA. But as addressed from a question, Jensen Huang of NVDA hasn’t brought much disappointment to markets, historically speaking, and I’m not expecting that to change.
Deductively, this also places more importance on US data as we’re going to be getting some items that were skipped during the government shutdown. And even if that data is old or stale, the way the market reacts remains key as it’ll show what could continue to drive trends in response.
So, for equities, I’m looking at this as more of an opportunistic pullback rather than the start of a doom-and-gloom scenario. There’s some massive supports in SPX at 6500 and ~6150-6200 and each represents an area of interest for longer-term bullish strategy.
SPX Daily Chart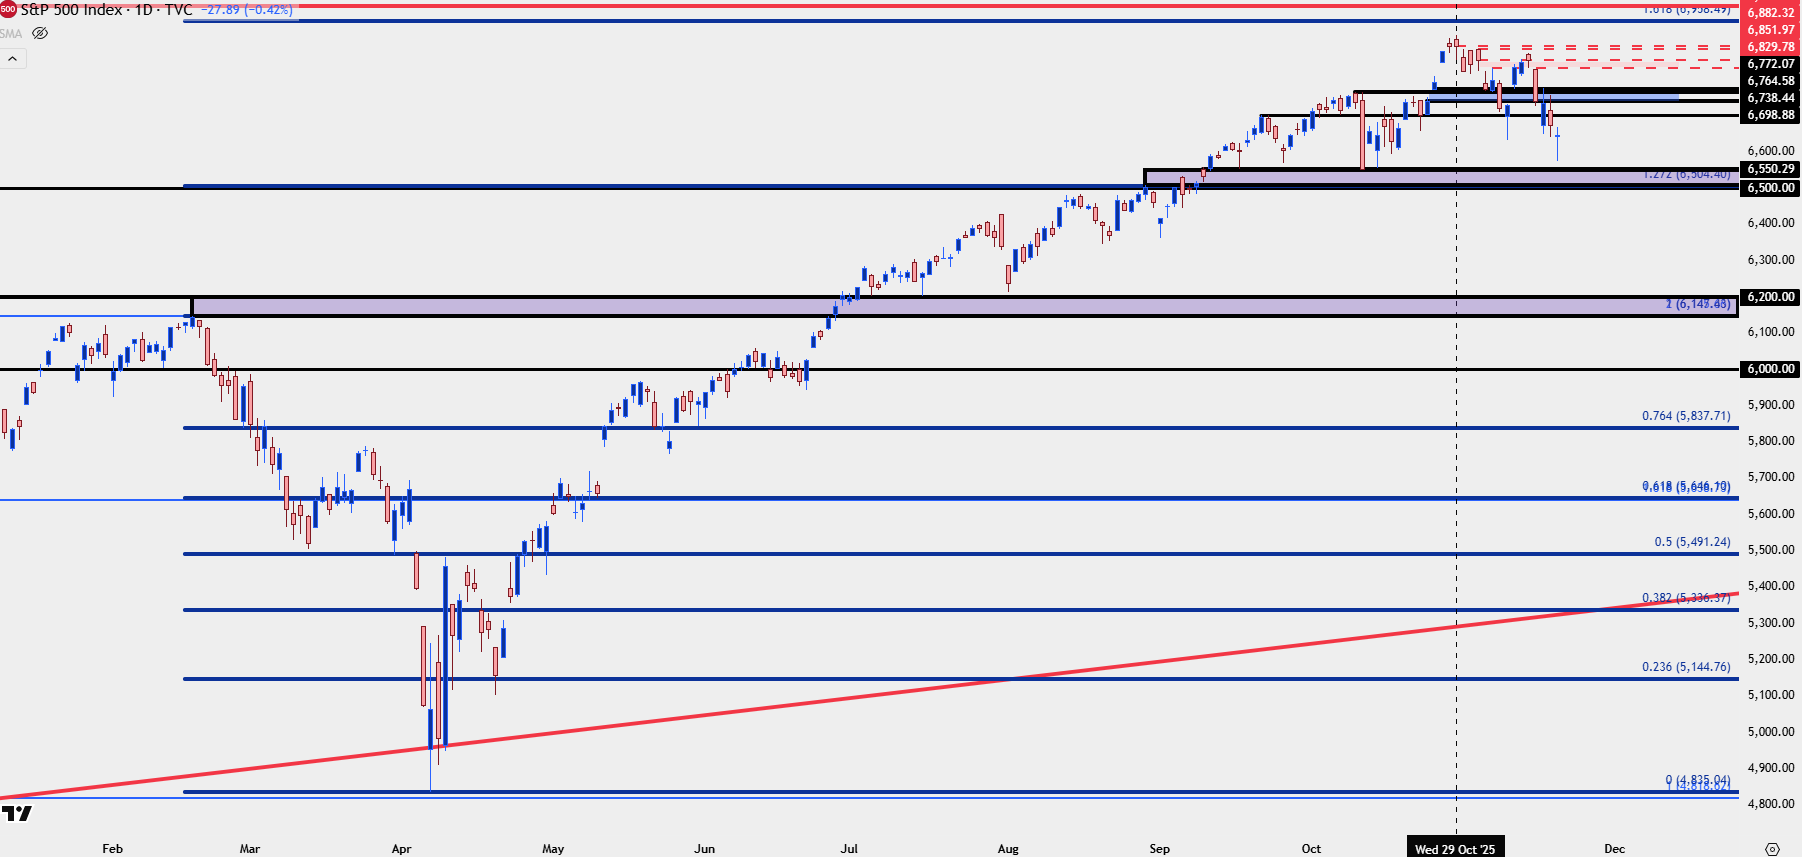
Chart prepared by James Stanley; data derived from Tradingview
Gold
I talked about gold later in the session but the fact that both gold and stocks have been going down lately, along with Bitcoin, further suggests this as more of a squaring up/profit taking type of theme rather than a major market inflection point.
I’m still looking at gold as bullish and so far today we have a hold of $4k to go along with a trendline test that was confluent with that price.
The next short-term resistance level overhead is at $4100, and buyers re-taking that re-opens the door for a push up to 4155 and then 4200 and perhaps even 4250.
But – until evidence shows that consolidation is completed, I’d hesitate to remain or get aggressive near those resistance points, as the consolidation episodes following prolonged rallies in gold spanned two months late last year and then four months this year, and the current episode is just about a month old at this point.
Gold Daily Price Chart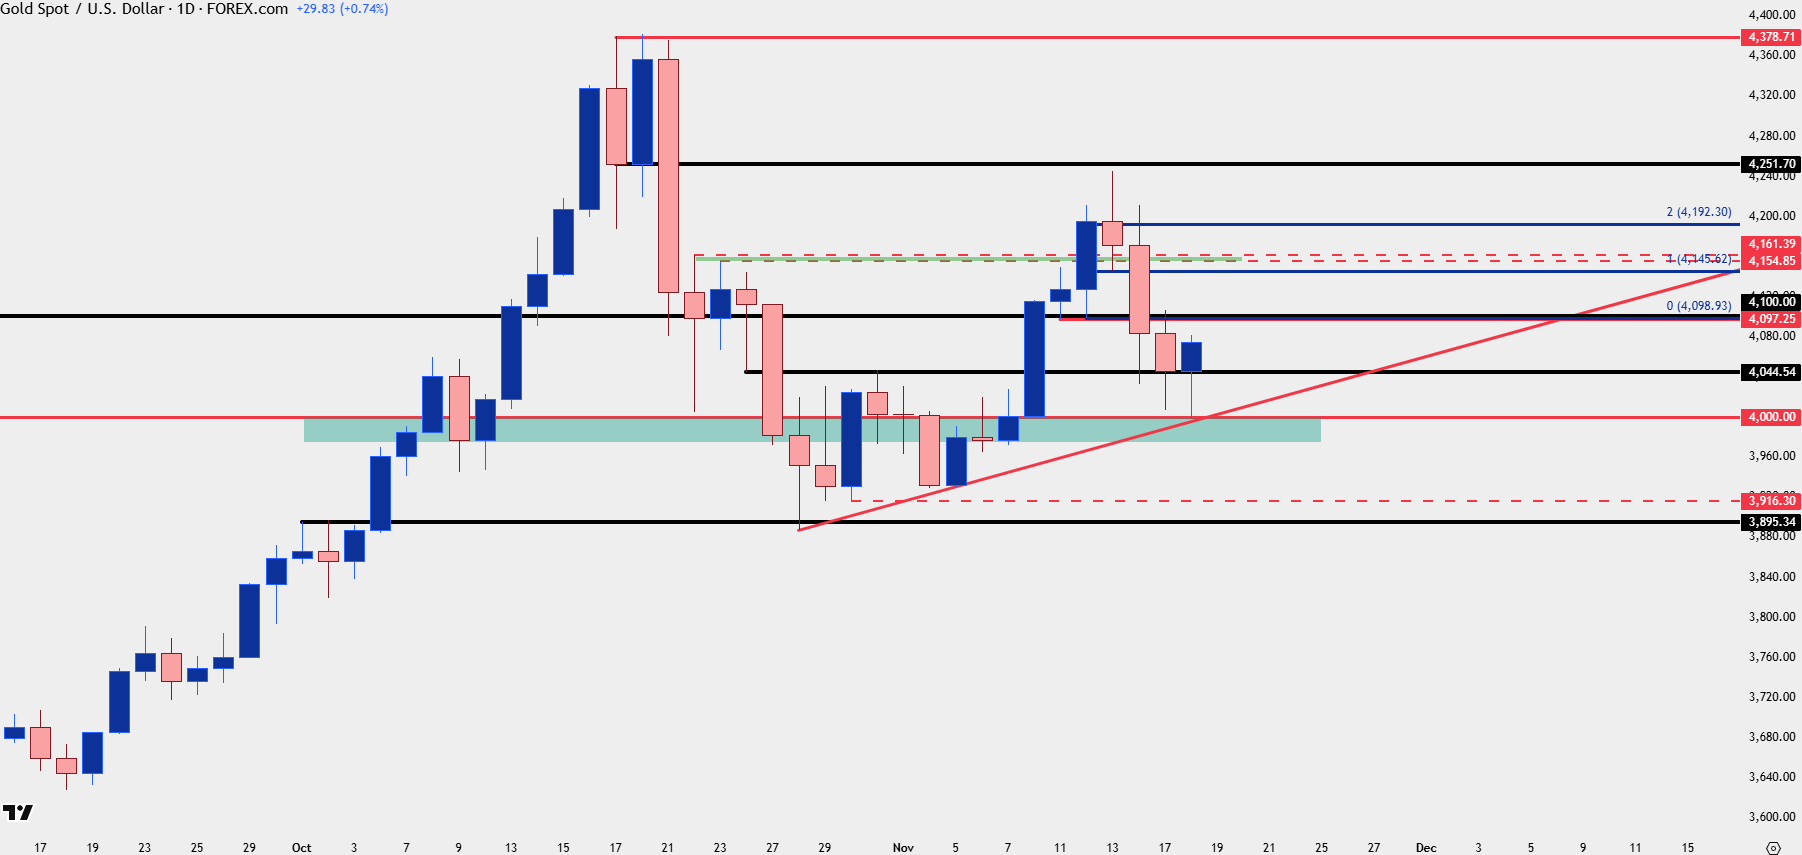
Chart prepared by James Stanley; data derived from Tradingview
USD
In USD, it’s been a hold of Fibonacci support at 98.98 so far, and this was the ‘s2’ level looked at in last week’s webinar. I also looked at this on Friday as it was showing its second consecutive day of holding lows, which helped to set up a morning star formation that’s so far led in to bounce.
The next objective for bulls is 99.72 after which the key zone from 100-100.22 comes into the picture.
US Dollar Daily Chart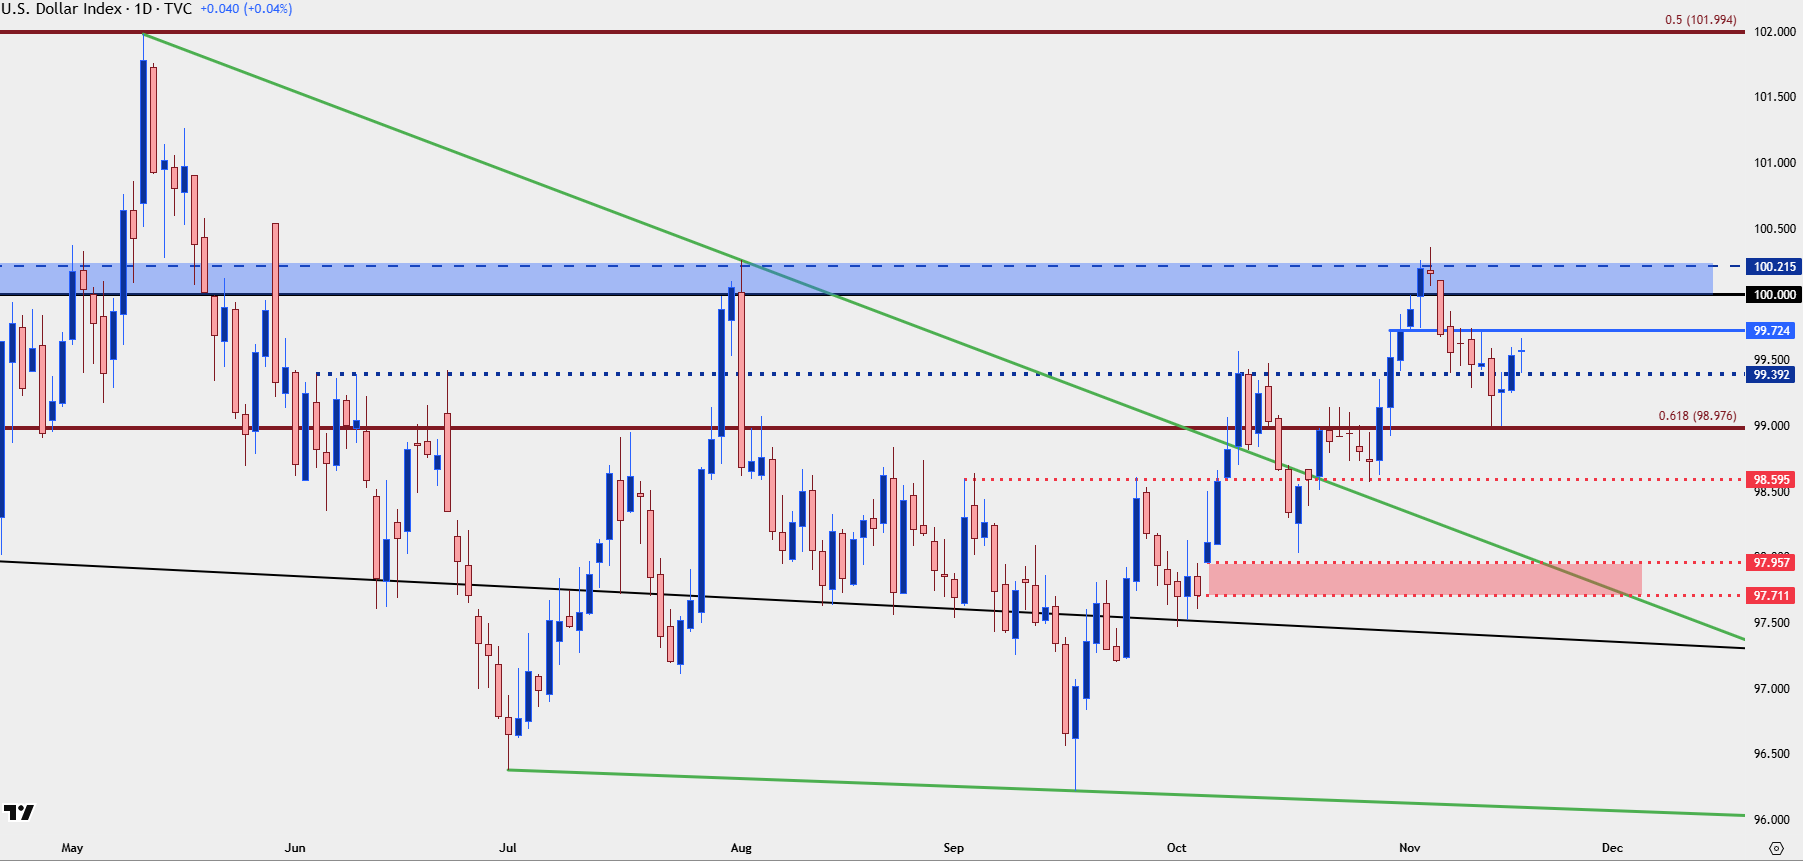
Chart prepared by James Stanley; data derived from Tradingview
EUR/USD
EUR/USD is still of interest for bearish USD scenarios, but EUR/USD bulls are going to need to act soon to retain that backdrop. So far, resistance has held inside of the prior lower-high at 1.1668 and buyers haven’t been able to hold support at the 1.1593-1.1600 zone. The 1.1542 level is still of interest, as this was the spot that set up the double bottom a month ago; but if buyers can’t hold that up then the next test of 1.1500 may not go as the first. Like I had warned a couple weeks ago, that psychological level has tended to take time to give way to trends in the pair and the most recent test was no different.
For resistance, 1.1668 is zoned up to the Fibonacci level at 1.1686, after which levels show at 1.1717 and then 1.1748.
EUR/USD Daily Price Chart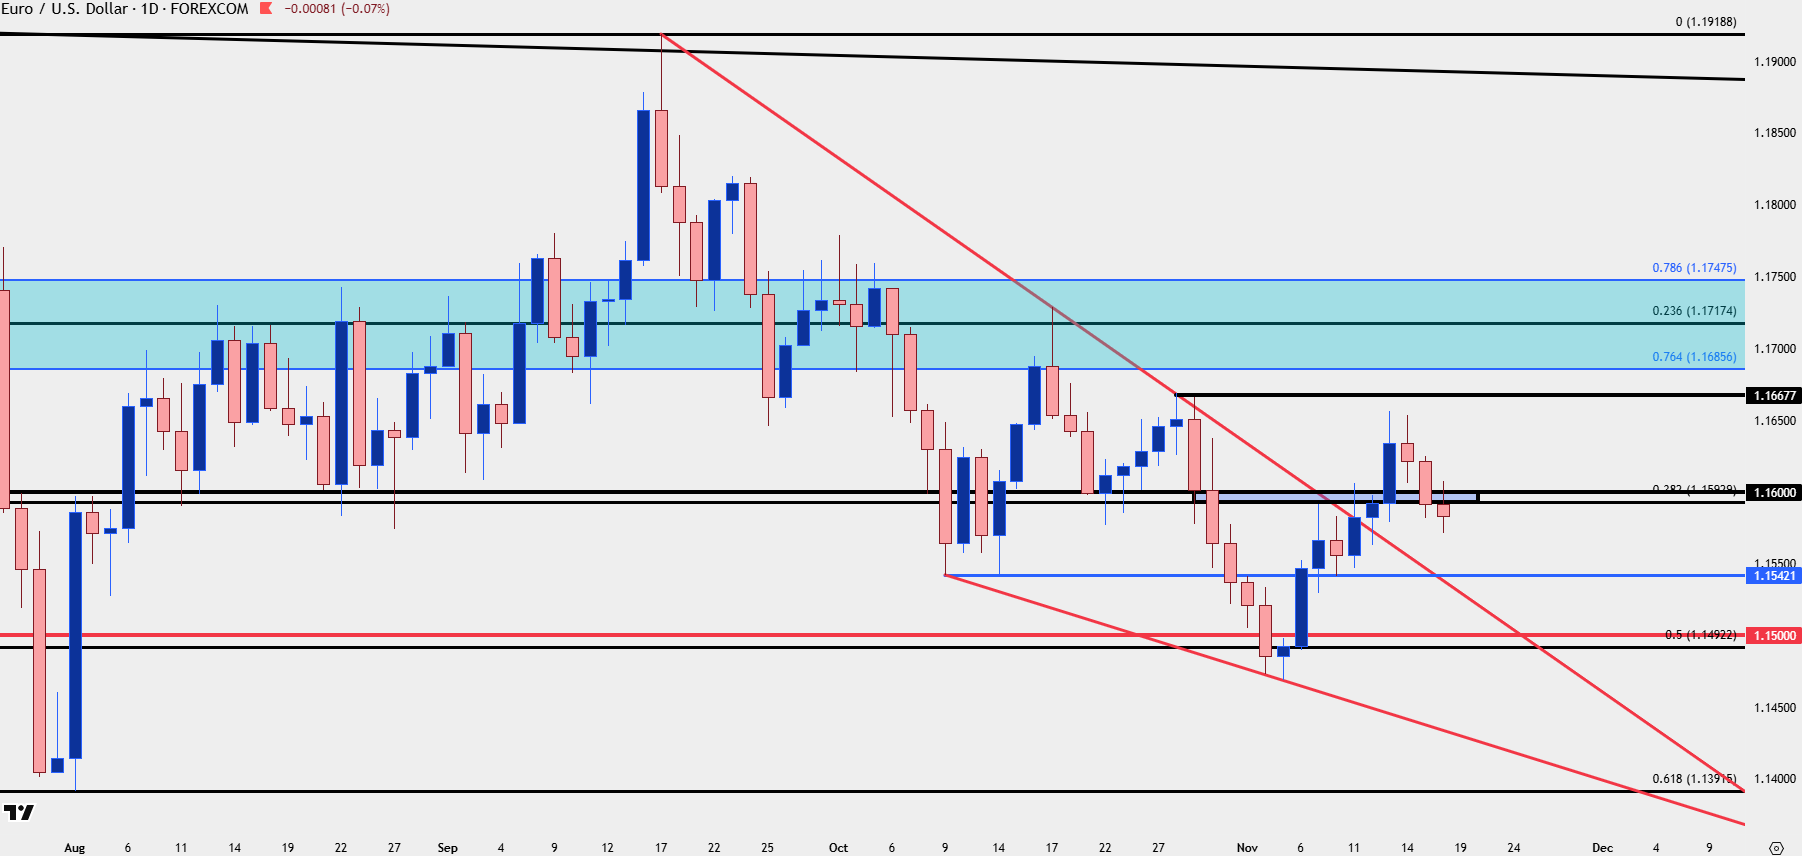
Chart prepared by James Stanley; data derived from Tradingview
GBP/USD
On a relative basis GBP/USD actually looks a touch better for USD-weakness scenarios than EUR/USD above. I showed the difference with short-term charts in the webinar and just a couple of weeks ago that would’ve been unthinkable.
But, like I shared then, deep oversold readings in the pair to go along with a push down towards the 1.3000 level made it undesirable for chasing and looking for USD-strength, and at this point, I consider the pair one of the more attractive if we do see USD-bears win out over the next couple of days with US data coming back online.
And related – this can further speak to FX market structure themes, with GBP/JPY and EUR/JPY more attractive for JPY-weakness setups, at the moment.
GBP/USD Four-Hour Chart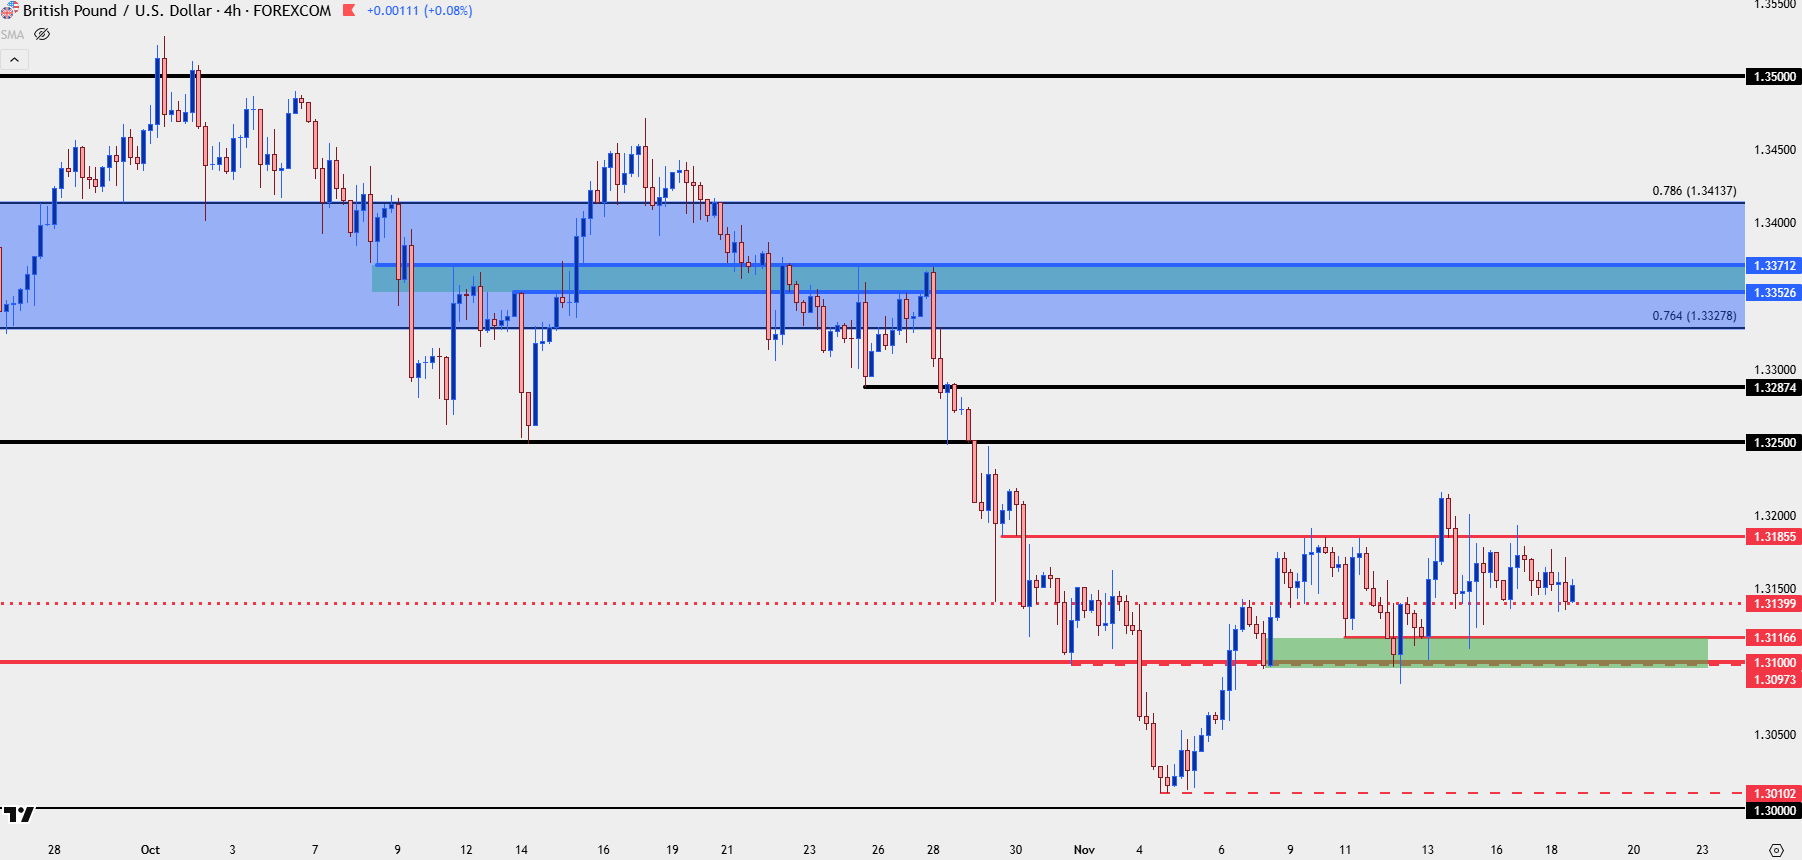
Chart prepared by James Stanley; data derived from Tradingview
USD/JPY
Yen-weakness remains as a dominant theme across the FX market and this is still my favored venue for USD-strength. As looked at yesterday and last week, I do still think that JPY-weakness can show attractively elsewhere, such as EUR/JPY and GBP/JPY.
But, at this point, pullbacks would be opportunistic until evidence suggests otherwise.
USD/JPY Daily Chart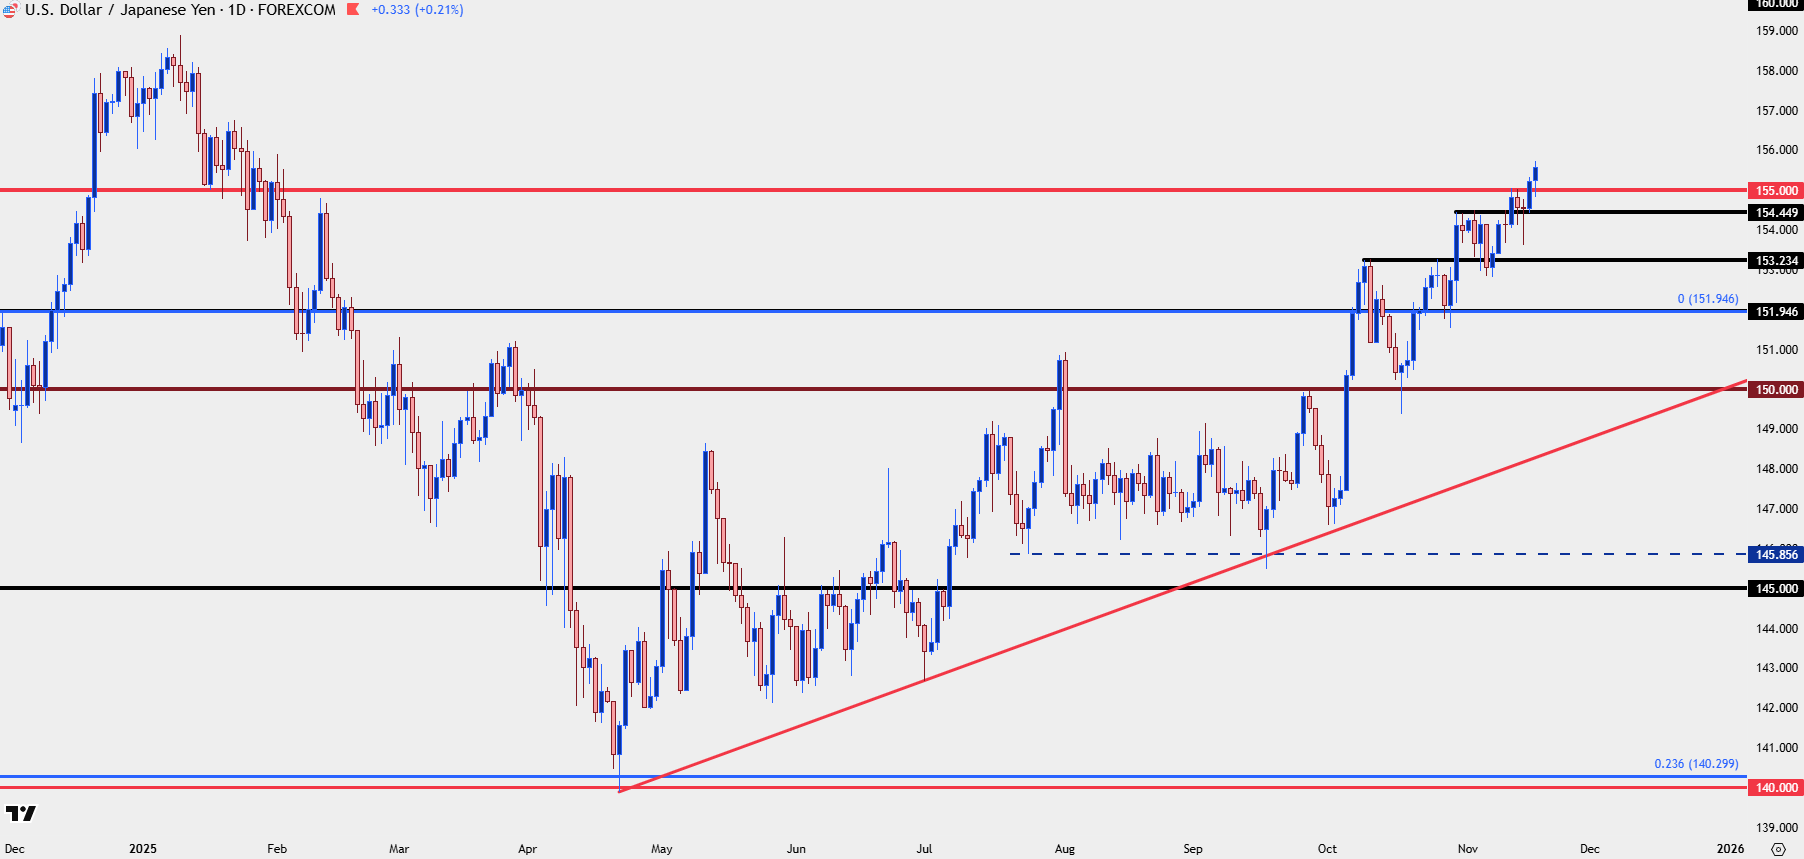
Chart prepared by James Stanley; data derived from Tradingview
--- written by James Stanley, Senior Market Analyst, Global Macro






