

For the past day there’s been something else for traders to focus on away from the still-brewing conflict in the Middle East, and that’s a slew of rate decisions with all of the Fed, BoJ, BoE and ECB announcing their most recent rates decisions. And while no actual adjustments were made, it was all about the innuendo and hints towards what might be down-the-road – and already we’ve seen fast adjustment in several markets.
But perhaps still more powerful for near-term volatility is the possibility of prolonged conflict and the center-point for that is crude oil prices.
There was a fast alignment of correlation across macro markets with the flare in crude prices earlier in March. Higher oil prices brought along higher inflation expectations, even more so for oil-vulnerable economies such as Europe or Japan. But there was also the inverse correlation with equity prices, as global stocks sold off and while sellers haven’t exactly taken over bigger picture trends in the US, there’s still a somewhat tenuous backdrop where that possibility cannot be dismissed. Given the harder hit to European and Japanese markets, the US Dollar floated higher as both the Euro and Japanese Yen sold off.
At the source of that continued concern is the trajectory of oil prices, which boils back to the Strait of Hormuz.
At this point, from the four-hour chart, a claim can be made towards consolidation which isn’t out of band considering last week’s doji. But it’s the way that consolidation has happened that keeps the door open for an increase in the drama, as we’ve seen the psychological level at 100 remain as resistance but buyers have continued to come in at higher-lows with the 95-handle helping to set current higher-low support.
Crude Oil Four-Hour Price Chart
Chart prepared by James Stanley; data derived from Tradingview
Crude Oil Daily
From the daily chart we can get better view of that consolidation, and I think what’s most meaningful here are the underside wicks and indecision candlesticks that have posted over the past couple of weeks, as clear illustration of buyers coming in intra-day to react to support tests at prior resistance.
But I think perhaps most meaningful is that 100-level, a major psychological price that has only traded briefly after weekly opens over the past two weeks. Each instance has so far led to profit taking, but the fact that prices are budging closer and closer to that level in an organic way indicates the possibility of acceptance at that price. And if we do see $100 WTI trade into the weekend, that’s the type of event that can have repercussions in many of those correlated markets, such as stocks or the USD.
WTI Crude Oil Daily Chart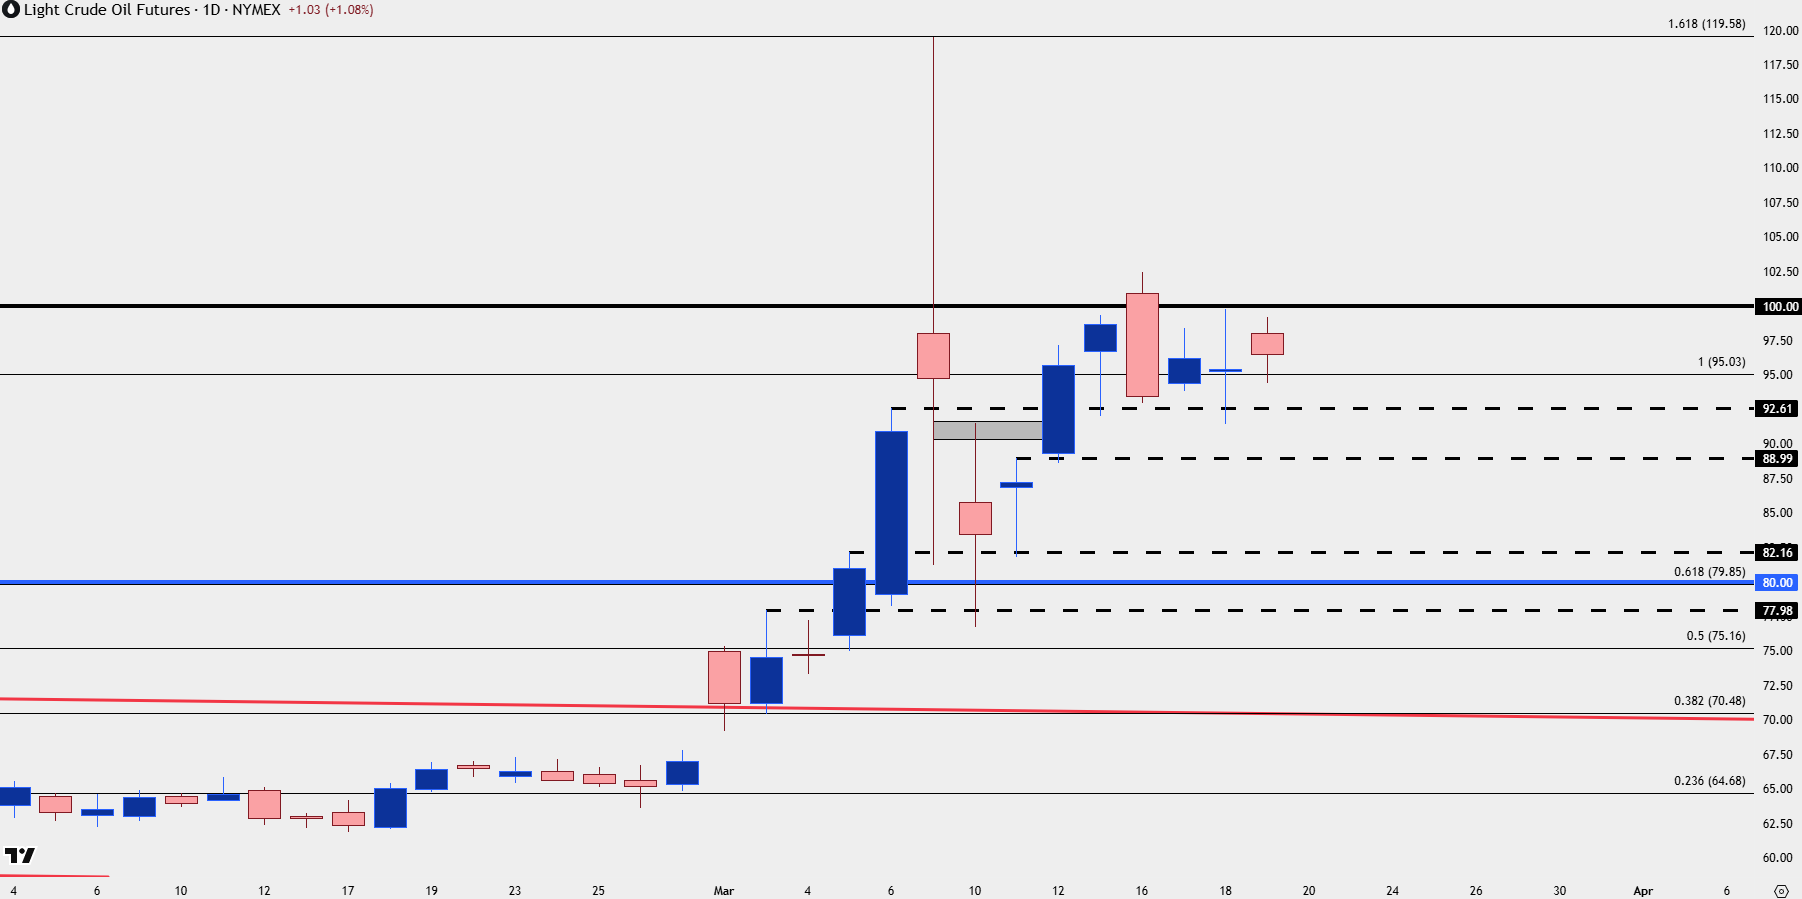
Chart prepared by James Stanley; data derived from Tradingview
--- written by James Stanley, Senior Market Analyst, Global Macro