
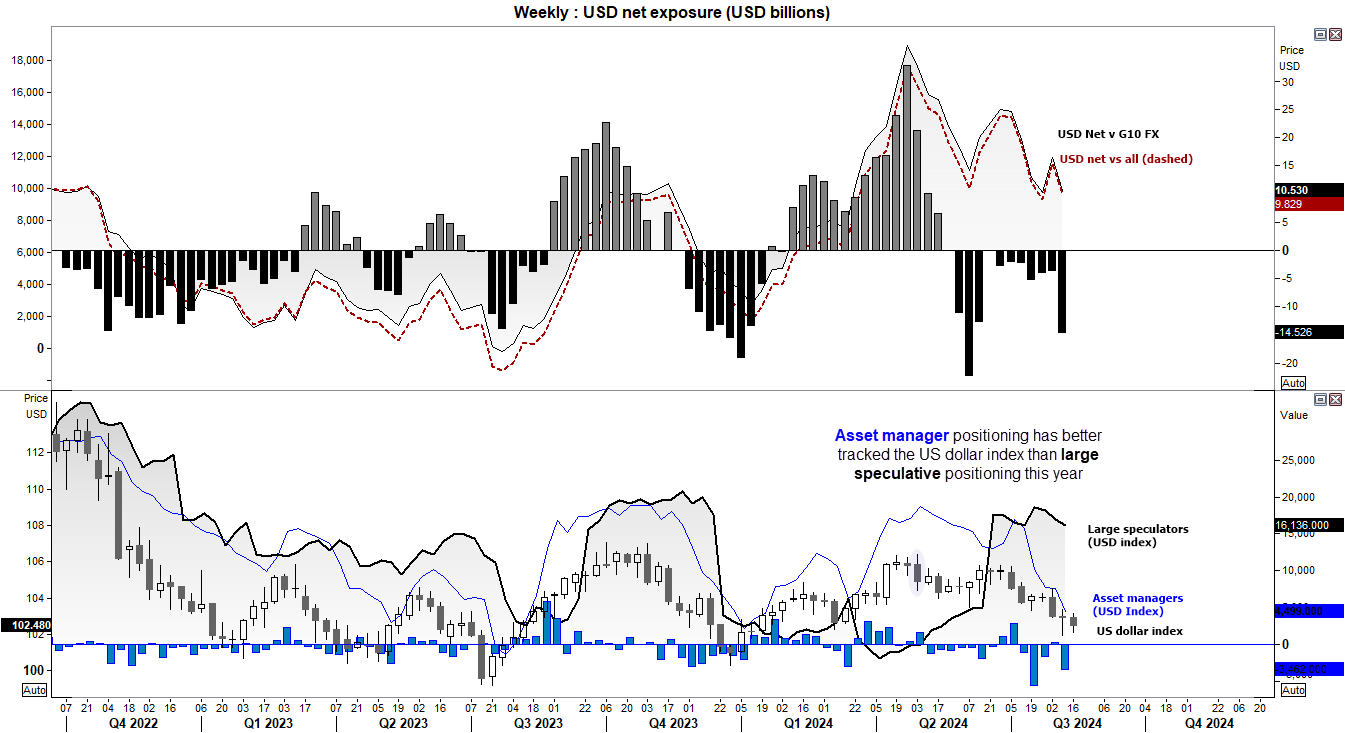
Market pricing has been anticipating a dovish Fed for quite some time, but it is only in recent weeks that price action has finally backed it up. We’ve now seen the US dollar index fall over -4% since its bearish engulfing candle 15 weeks ago, and for the most part this is being backed up my futures market positioning.
US dollar futures positioning – COT report
Net-long exposure to the USD dollar against G10 currencies has continued to fall, since the US dollar index peaked 15 weeks ago. That said, they remain net-long by around $10 billion. Net-long exposure of asset managers on the US dollar index itself is not at its least bullish level since January. The odd one out are large speculators, as net-long exposure has hovered between he 16k-18.5k area over the past two months. It therefore seems relevant to point out that large speculators were proven wrong when they last diverged from asset managers in Q2.
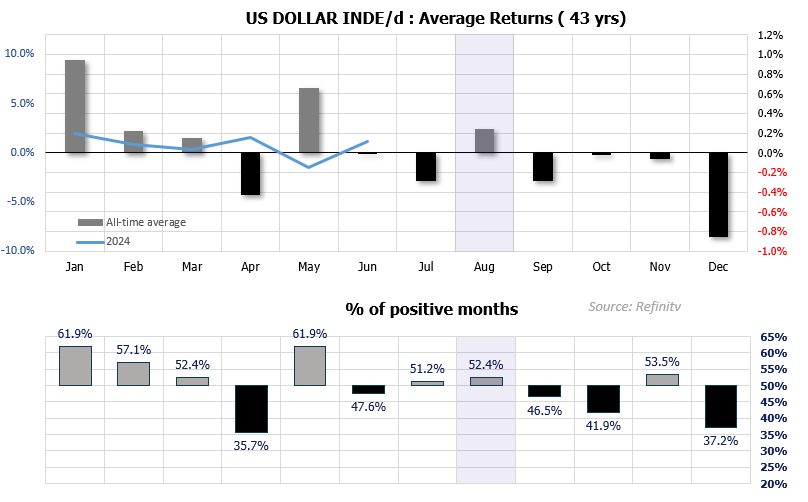
Seasonality has slightly favoured US dollar bulls in August
Ultimately, a lower US dollar over the coming months seems likely. But we’ve already seen quite a sizeable move to the downside which brings the potential for a bounce. And we may have seen the early stages of that on Wednesday. Furthermore, the US dollar index has averaged positive returns of 0.24% over the past four decades with a slightly positive expectancy of 52.4%. These may not be compelling odds, but in context that we’ve seen the US dollar and positioning mostly fall over the past 15 weeks, I suspect some mean reversion is due.
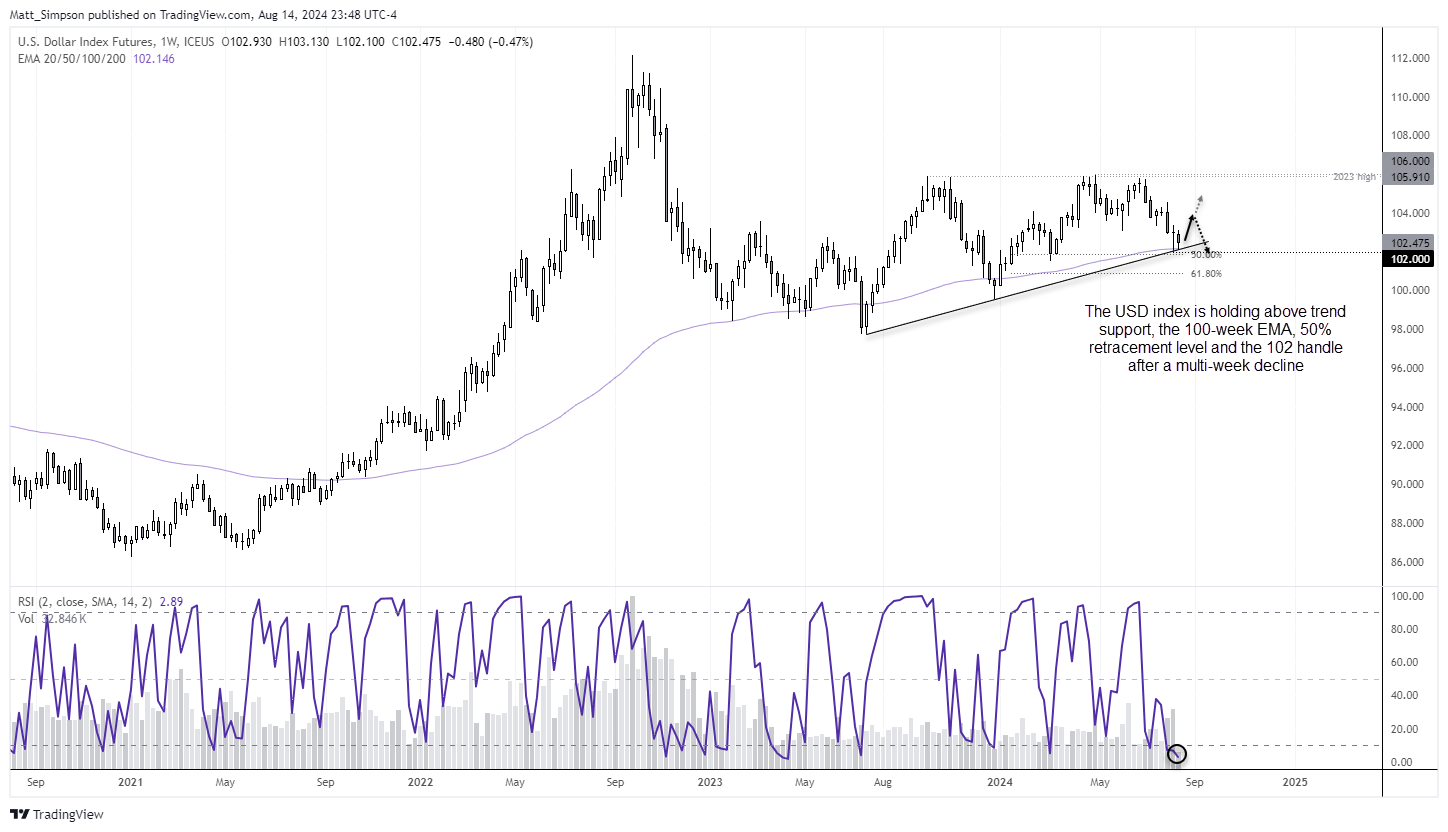
US dollar index technical analysis:
The weekly chart shows that support has been found at the July 2023 trendline and 100-week EMA. The 50% retracement level between the July low and April high and 102 handle are also nearby, and last week’s candle was a bullish pinbar. Prices are now trading (but holding above) the low of the pinbar and within the candle’s wick. And with the weekly RSI (2) also oversold, I suspect we’re seeing the early stages of a trough forming.
The daily chart shows that support has also been found around the February VPOC (volume point of control) and a slight bullish divergence has formed on the daily RSI (14). A bullish pinbar formed on Wednesday which also held above the August 5th low, which further suggests demand around these lows. This is not to say that bears cannot have another stab at taking out these cycle lows, but given that a ‘dovish Fed’ is no longer new news and that the USD index is holding above a multitude of support levels, these do not look like great levels for bears to be initiating fresh positions to me.
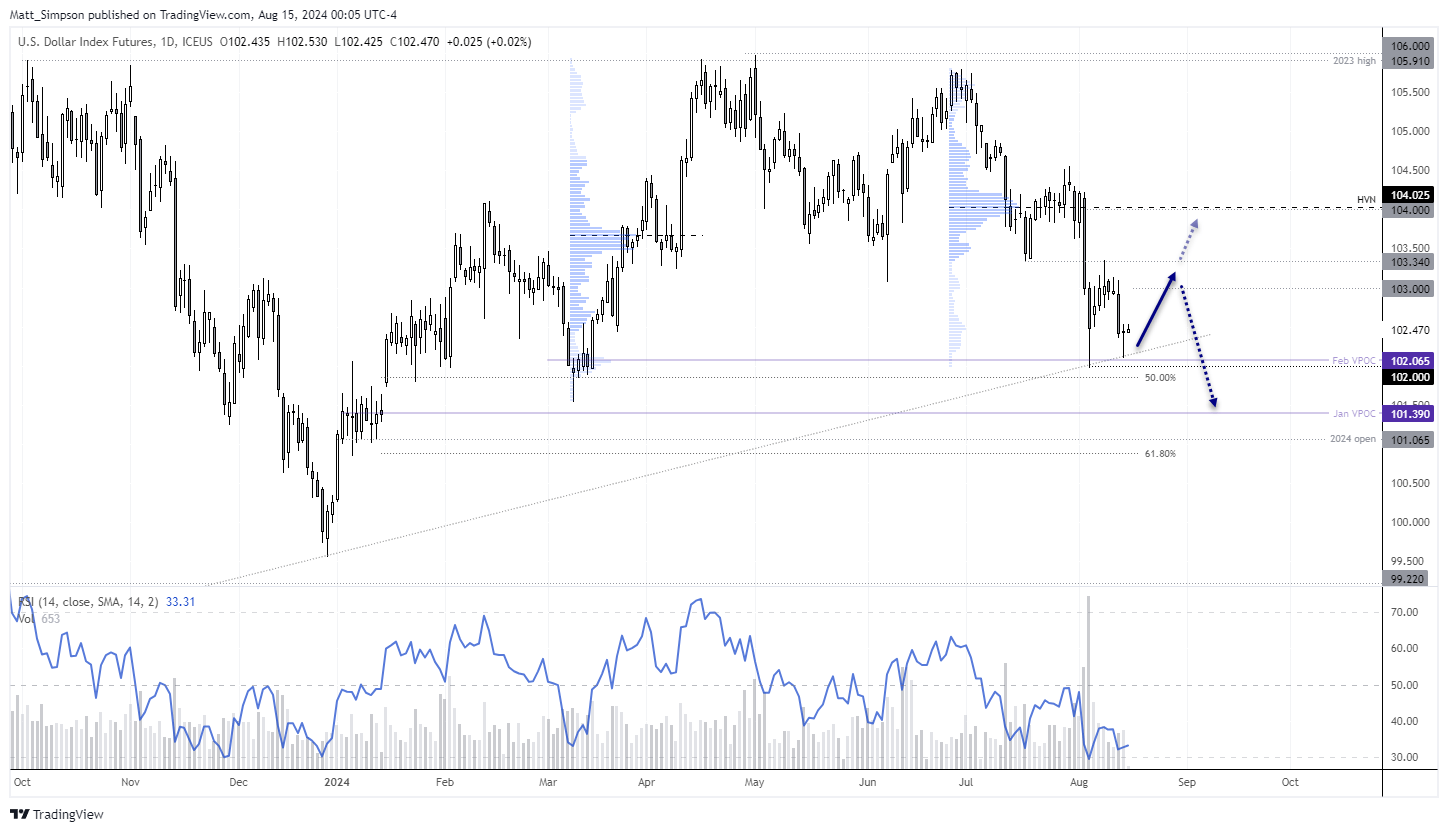
- Bulls could seek dips towards 102 an anticipation of a countertrend bounce to 103
- Higher upside targets could be considered if incoming data or themes allow
- A break above 103.50 brings the high-volume node (HVN) into focus around 104
- A daily close below 102 assumes bearish continuation
- For now, I’m simply seeing a countertrend bounce after an already established bearish move, on well-known bearish news
-- Written by Matt Simpson
Follow Matt on Twitter @cLeverEdge