Unilever, the consumer goods company, announced that underlying sales fell 0.3% in the three months ended June 30, beating estimates. 1H underlying EPS grew 6.4% on year to 1.35 euro on revenue of 25.7 billion euros, down 1.6% (underlying sales growth -0.1%). E-commerce sales jumped 49%.
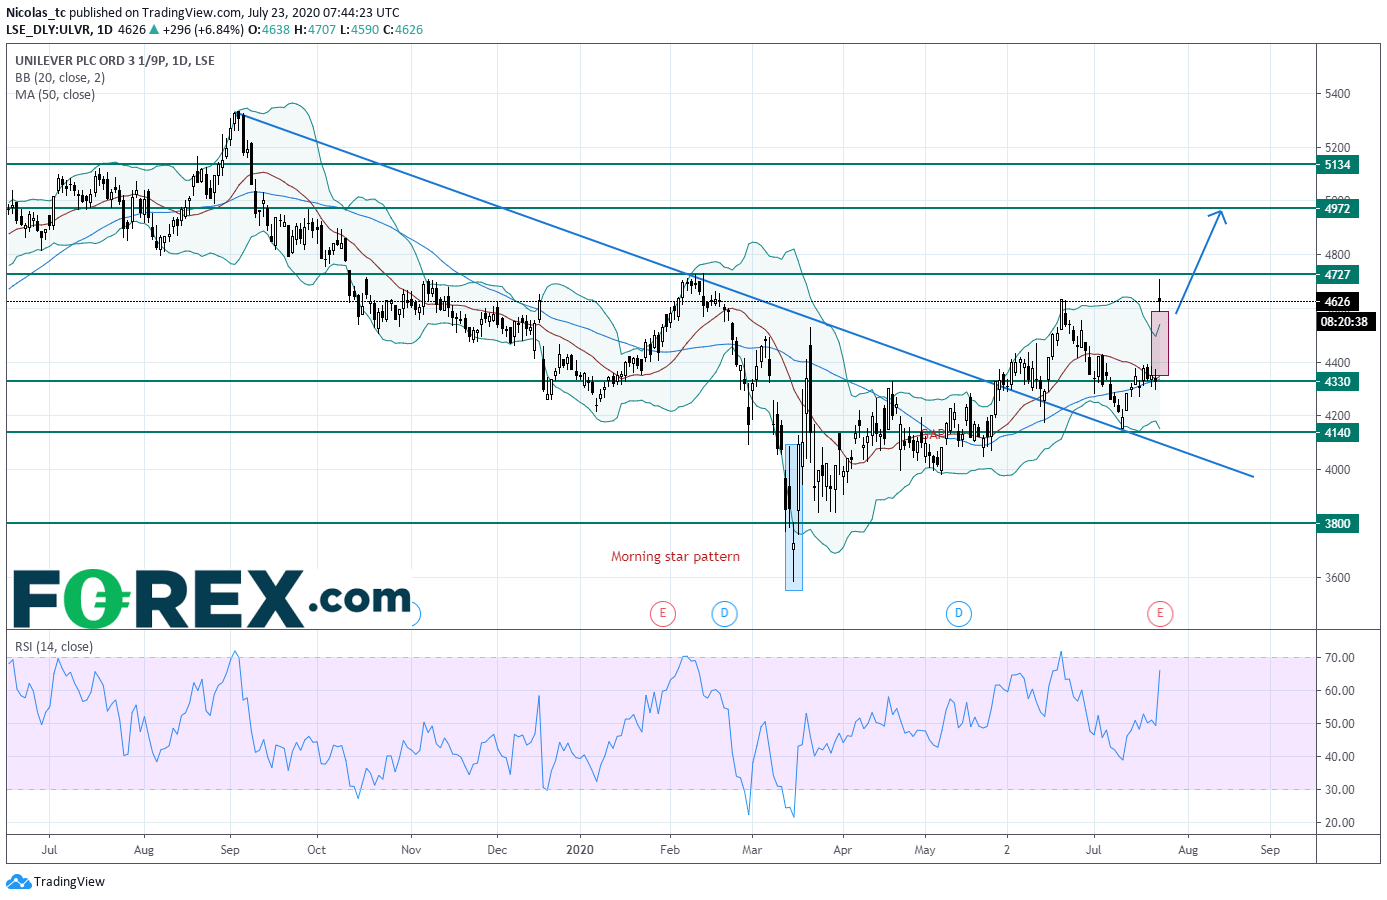
From a technical perspective, the morning star pattern formed in March on a daily chart remains in play. It is a sign of a reversal in the previous price down trend. Prices are holding above a former declining trend line which will now play a support role (polarity principle). The stock price is trading above its upper Bollinger band thanks to the bullish gap opened this morning. In addition, a piercing line pattern on a weekly chart has been validated. A break above 4727p would open a path to see 4972p. Only a break below 4330p would invalidate the bullish bias.
Source: GAIN Capital, TradingView