



US CPI higher than expected. Could the Fed hike 50bps?
How much longer could inflation be sustained at this level?
Share this:

The January US CPI print was 7.5% YoY vs and expectation of 7.3% YoY and 7.0% YoY in December. This was the highest level since February 1982. In addition, the Core Inflation Rate, which excludes volatile food and energy prices, was up 6% YoY in January vs 5.9% YoY expected and 5.5% YoY in December. (See our CPI Preview here.) According to the CME Fedwatch tool, markets are now pricing in nearly a 50% chance of a 50bps hike in March. Before the CPI data, chances were in the in the 33% range. In addition, markets are now pricing in a chance of a full percentage point increase (100bps) by the June 15th meeting.

Source: CME
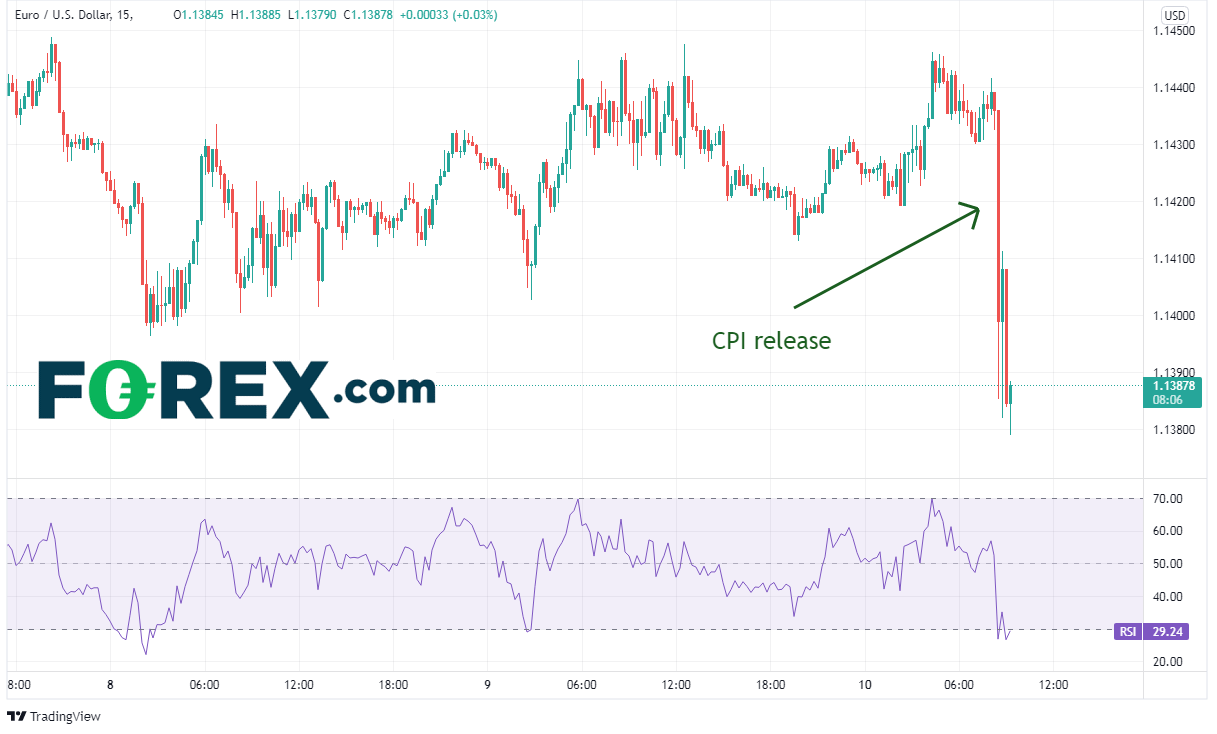
On the release of the data, stocks and bonds sold off, while the US Dollar went bid. The yield on the US 10-year bond traded up to the psychological round number resistance level of 2.00%, its highest level since August 2019.

Source: Tradingview, Stone X
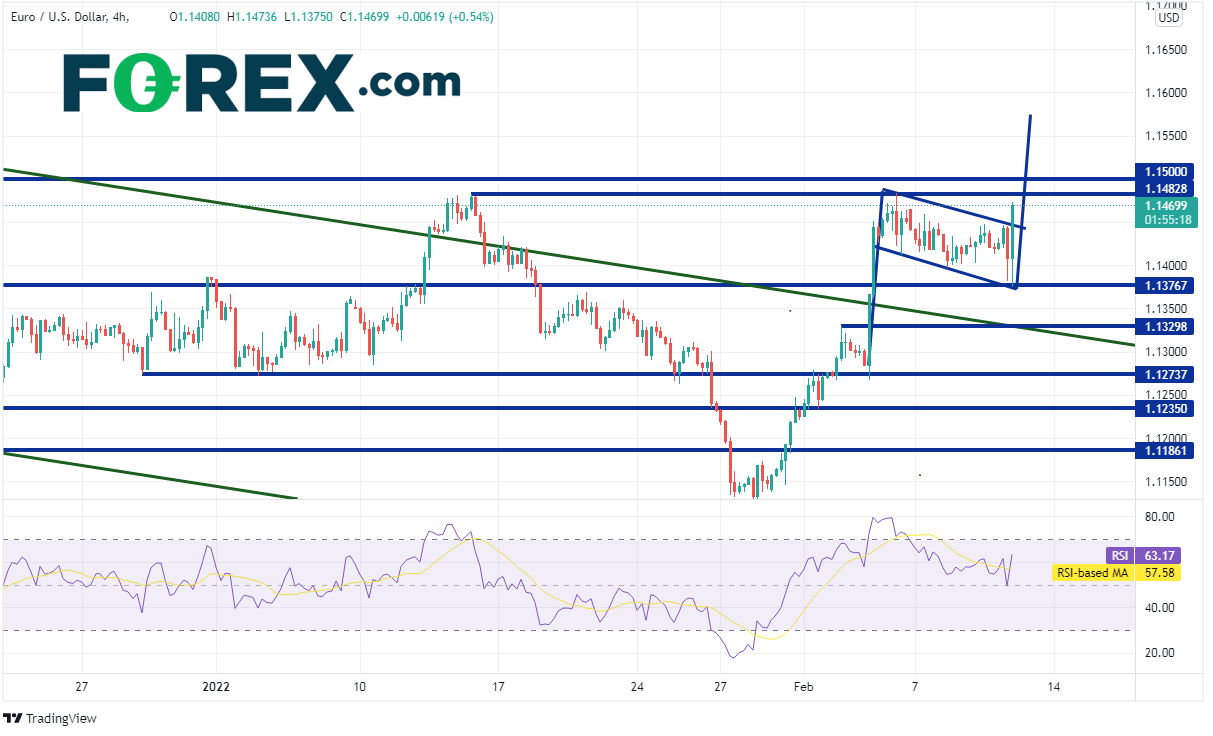
As mentioned, the US Dollar went bid immediately following the CPI release. Therefore EUR/USD moved lower. On a 240-minute timeframe, the pair has been moving higher since posting a false breakdown below the previous lows of November 24th, 2021, reaching at low at 1.1121. However, on February 3rd after the slightly hawkish ECB meeting (previously a dovish stance), EUR/USD moved aggressively higher, reaching a near-term high of 1.1484. 1.1490/1.1500 has been long-term resistance. The pair then pulled back in a flag formation and today, touched horizontal support and the trendline for the bottom of the flag at 1.1376.
Source: Tradingview, Stone X
EUR/USD stayed within the flag after holding the support and reversed to the upside, breaking above the formation. However, price is approaching a resistance zone between 1.1482 and 1.1500. If EUR/USD can break above, price many be on its way to the flag target near 1.1575. First support is at the top trendline of the flag near 1.4455, then the bottom of the flag near 1.1376. If price breaks below there, horizontal support crosses at 1.1330.
Source: Tradingview, Stone X
The CPI data for January was strong, and markets were quick to recognize it! However, how much longer could inflation be sustained at this level? Will the Fed hike 50bps at the March meeting to help stem the rise of inflation? With the FOMC meeting a little over a month away, traders should also be prepared, just in case the Fed decides to “jump the gun” with an unexpected intra-meeting rate hike!
The January US CPI print was 7.5% YoY vs and expectation of 7.3% YoY and 7.0% YoY in December. This was the highest level since February 1982. In addition, the Core Inflation Rate, which excludes volatile food and energy prices, was up 6% YoY in January vs 5.9% YoY expected and 5.5% YoY in December. (See our CPI Preview here.) According to the CME Fedwatch tool, markets are now pricing in nearly a 50% chance of a 50bps hike in March. Before the CPI data, chances were in the in the 33% range. In addition, markets are now pricing in a chance of a full percentage point increase (100bps) by the June 15th meeting.
Source: CME
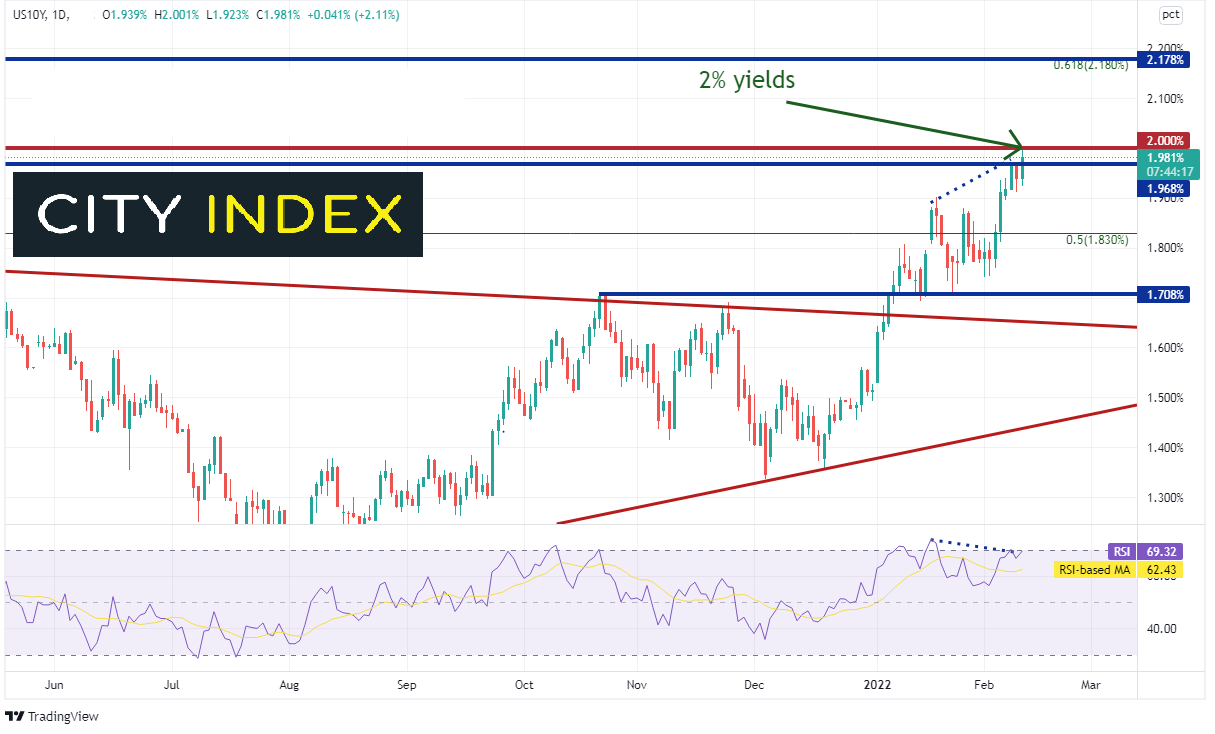
On the release of the data, stocks and bonds sold off, while the US Dollar went bid. The yield on the US 10-year bond traded up to the psychological round number resistance level of 2.00%, its highest level since August 2019.
Source: Tradingview, Stone X
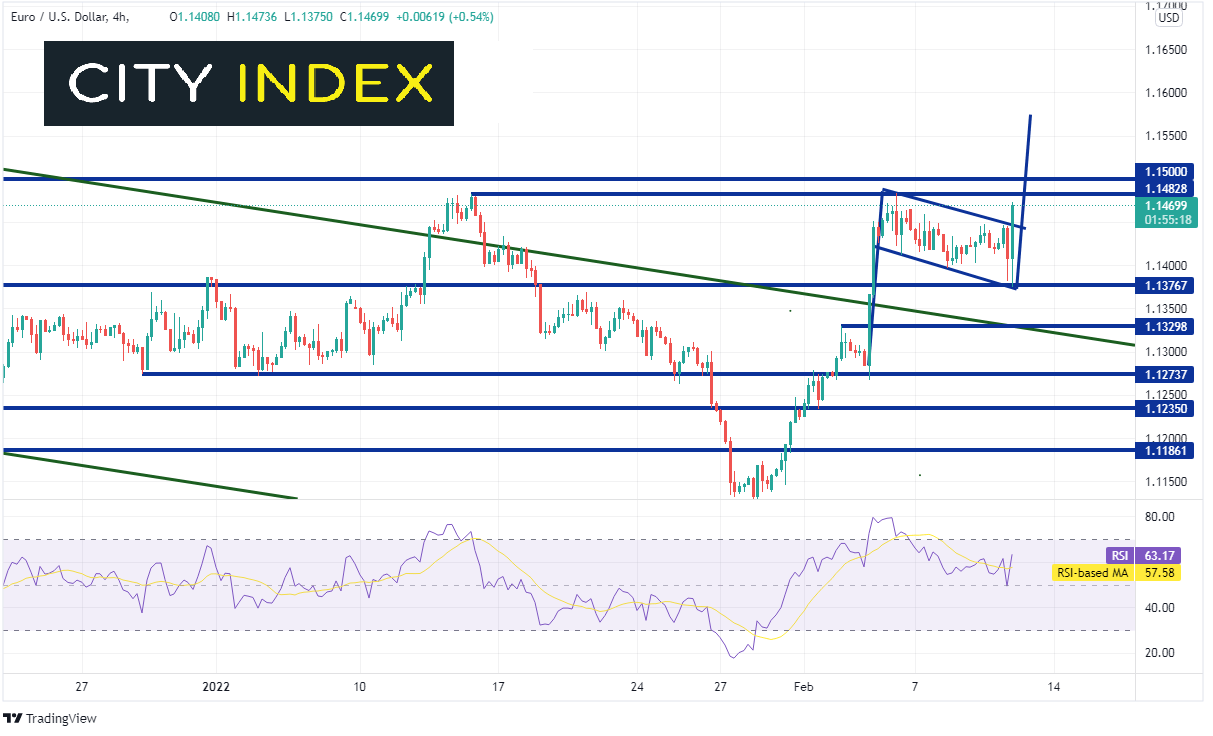
As mentioned, the US Dollar went bid immediately following the CPI release. Therefore EUR/USD moved lower. On a 240-minute timeframe, the pair has been moving higher since posting a false breakdown below the previous lows of November 24th, 2021, reaching at low at 1.1121. However, on February 3rd after the slightly hawkish ECB meeting (previously a dovish stance), EUR/USD moved aggressively higher, reaching a near-term high of 1.1484. 1.1490/1.1500 has been long-term resistance. The pair then pulled back in a flag formation and today, touched horizontal support and the trendline for the bottom of the flag at 1.1376.

Source: Tradingview, Stone X
Trade EUR/USD now: Login or Open a new account!
• Open an account in the UK
• Open an account in Australia
• Open an account in Singapore
EUR/USD stayed within the flag after holding the support and reversed to the upside, breaking above the formation. However, price is approaching a resistance zone between 1.1482 and 1.1500. If EUR/USD can break above, price many be on its way to the flag target near 1.1575. First support is at the top trendline of the flag near 1.4455, then the bottom of the flag near 1.1376. If price breaks below there, horizontal support crosses at 1.1330.
Source: Tradingview, Stone X
The CPI data for January was strong, and markets were quick to recognize it! However, how much longer could inflation be sustained at this level? Will the Fed hike 50bps at the March meeting to help stem the rise of inflation? With the FOMC meeting a little over a month away, traders should also be prepared, just in case the Fed decides to “jump the gun” with an unexpected intra-meeting rate hike!
Learn more about forex trading opportunities.
Related tags:



Open an account in minutes
Experience award-winning platforms with fast and secure execution.
Economic calendar
Web Trader platform
Our sophisticated web-based platform is packed with features.
Related articles

Australian Dollar Outlook: AUD/USD Bears Eye March Low as US CPI Looms
Australian Dollar Outlook: AUD/USD Bears Eye March Low as US CPI Looms


Euro Technical Forecast: EUR/USD Five-Week Range Puts Yearly Lows on the Line 11 7 2026
Euro support has held, but the bulls have struggled to gain ground as next week's U.S. CPI sets the stage for a potentially decisive EUR/USD breakout.


Gold weekly outlook: XAU/USD holds above $4,000 despite strong US jobs data
Gold has held above $4,000 despite a much stronger-than-expected October jobs report. Fawad Razaqzada explains why lower yields and the tech sell-off have supported the metal, and why next week's US CPI could decide its next move.

The information on this web site is not targeted at the general public of any particular country. It is not intended for distribution to residents in any country where such distribution or use would contravene any local law or regulatory requirement. The information and opinions in this report are for general information use only and are not intended as an offer or solicitation with respect to the purchase or sale of any currency or CFD contract. All opinions and information contained in this report are subject to change without notice. This report has been prepared without regard to the specific investment objectives, financial situation and needs of any particular recipient. Any references to historical price movements or levels is informational based on our analysis and we do not represent or warranty that any such movements or levels are likely to reoccur in the future. While the information contained herein was obtained from sources believed to be reliable, author does not guarantee its accuracy or completeness, nor does author assume any liability for any direct, indirect or consequential loss that may result from the reliance by any person upon any such information or opinions.
Futures, Options on Futures, Foreign Exchange and other leveraged products involves significant risk of loss and is not suitable for all investors. Losses can exceed your deposits. Increasing leverage increases risk. Spot Gold and Silver contracts are not subject to regulation under the U.S. Commodity Exchange Act. Contracts for Difference (CFDs) are not available for US residents. Before deciding to trade forex, commodity futures, or digital assets, you should carefully consider your financial objectives, level of experience and risk appetite. Any opinions, news, research, analyses, prices or other information contained herein is intended as general information about the subject matter covered and is provided with the understanding that we do not provide any investment, legal, or tax advice. You should consult with appropriate counsel or other advisors on all investment, legal, or tax matters. References to FOREX.com or GAIN Capital refer to StoneX Group Inc. and its subsidiaries. Please read Characteristics and Risks of Standardized Options.