US Dollar
So far – the Fibonacci support at 97.94 has held the lows in the USD. Earlier in the month I highlighted this zone as a spot of support potential for the Greenback as this was the resistance side of the ascending triangle that had formed into the March open.
From the daily, this still has the look of a pullback in a bearish near-term trend. Shorter-term, this can be justified for strength which I’ll look at in a moment.
US Dollar Daily Price Chart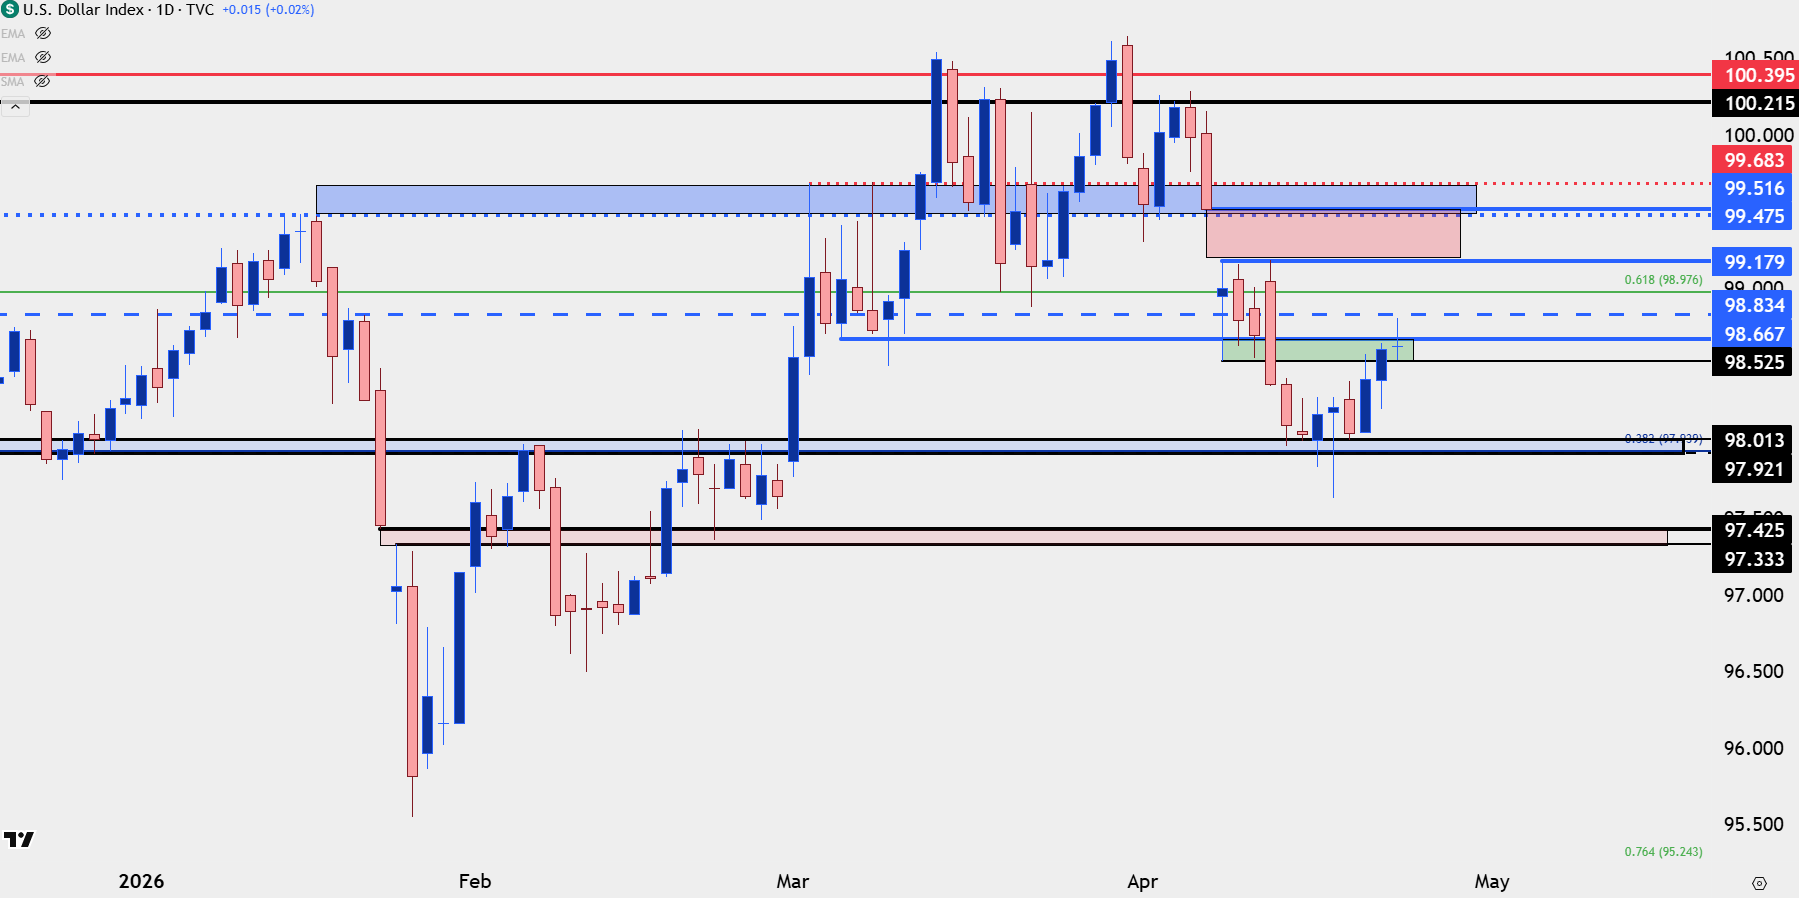
Chart prepared by James Stanley; data derived from Tradingview
USD Shorter-Term
From the four-hour chart we can see a fresh series of higher-highs and lows and this keeps the door open for buyers to make a further push. The big area of interest is the gap from the ceasefire announcement a few weeks ago, but for that to come into play we’re probably going to also need USD/JPY testing above the 160.00 handle, which remains a possible scenario as we go into BoJ next week.
US Dollar Four-Hour Chart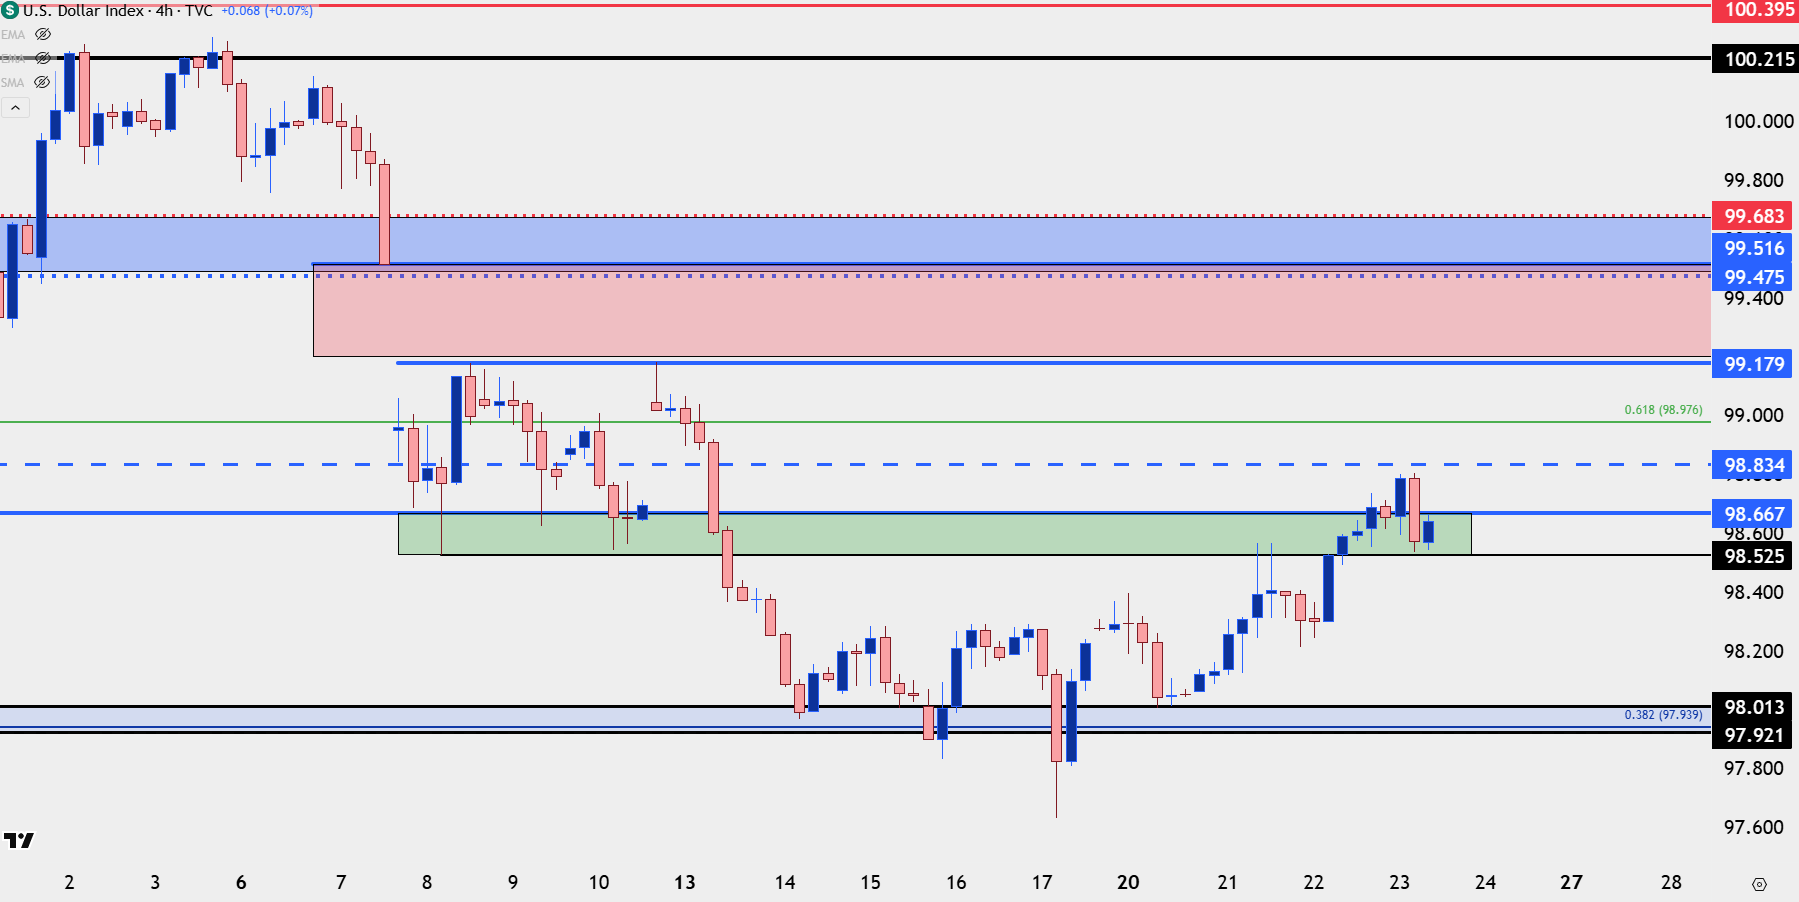
Chart prepared by James Stanley; data derived from Tradingview
EUR/USD
The EUR/USD rally ln the back of USD weakness into last Friday ran cleanly until resistance showed at 1.1833, a spot of prior support turned resistance.
Earlier this week, bulls attempted to hold a bounce from support but that was faded at a lower-high, and the sell-off has extended through this week with prices now testing the 1.1700 level.
The next zone of support down is a big one, as this was resistance for much of March at 1.1628-1.1655. I’m keeping this on the bearish USD side of the ledger for now, although GBP/USD may be a touch more attractive for that end as I’ll look at in a moment.
EUR/USD Daily Chart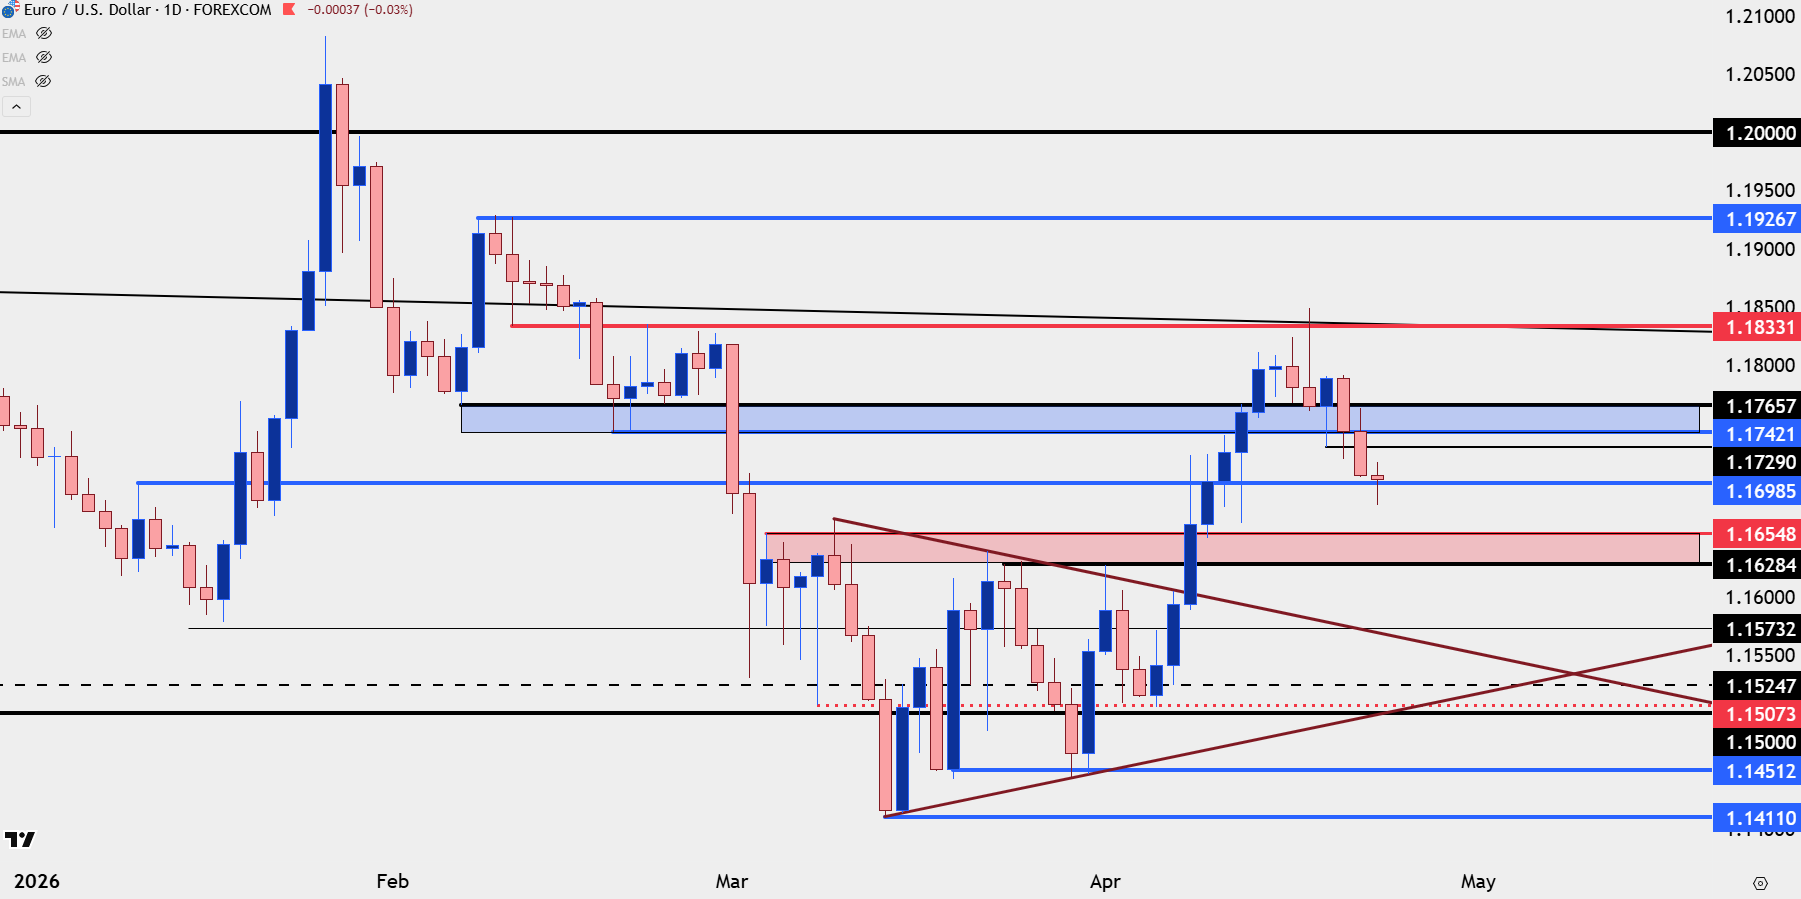
Chart prepared by James Stanley; data derived from Tradingview
GBP/USD
While EUR/USD is sinking to a fresh near-term low today, GBP/USD is still testing horizontal support from prior resistance at 1.3484. That same price was in-play on Monday and Tuesday and this highlights a case of divergence between EUR/USD and GBP/USD, which can make the latter as slightly more attractive for strength if meshing up with a weaker currency, like the Japanese Yen or potentially the US Dollar.
GBP/USD Daily Chart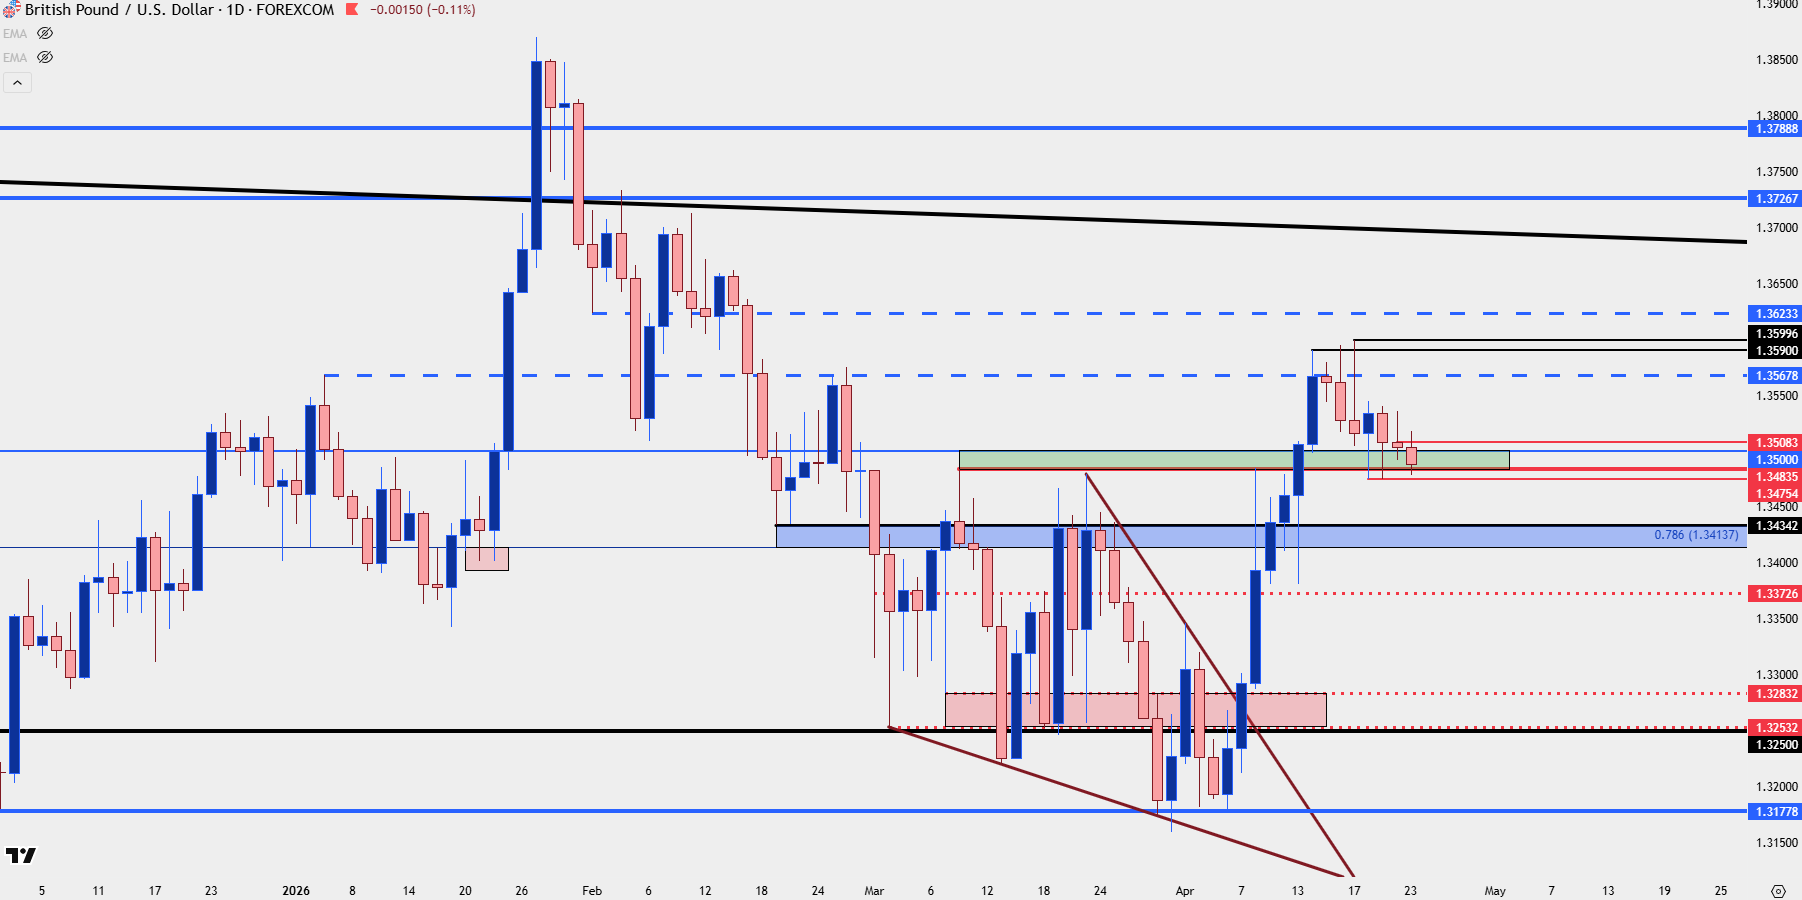
Chart prepared by James Stanley; data derived from Tradingview
USD/JPY
USD/JPY has held up remarkably well during the USD sell-off, with USD/JPY creating a range with multiple bounces from the 158.00 area of support from prior resistance. This one remains a hot button, however, as scenarios that do bring on USD-strength could also bring on a test of the 160.00 level in the pair, and in that scenario, there’s question as to whether the BoJ and the MoF would want to be aggressive with interventions. Instead, levels like 161.95 or 165.00 may make more sense as a spot of defense if we do see USD strength to continue.
For now, USD/JPY is near range resistance and if we do see a push of USD-weakness ahead of the weekly close, it’s the same 157.66-157.90 zone that remains of attraction for support potential.
USD/JPY Daily Chart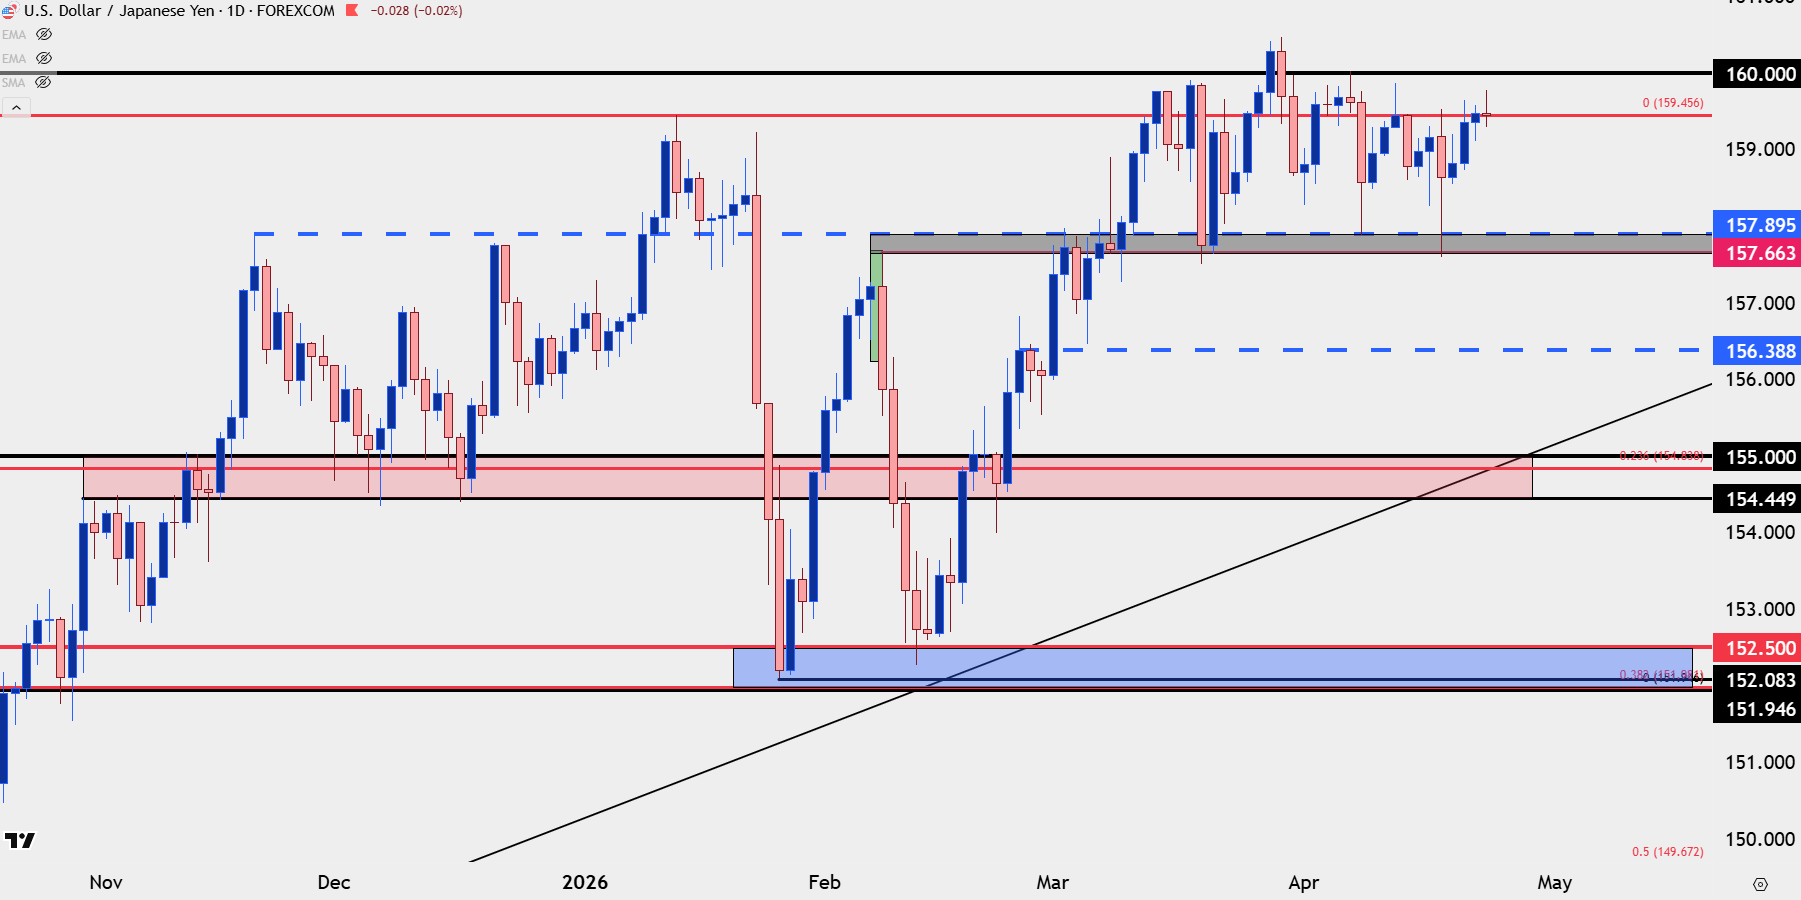
Chart prepared by James Stanley; data derived from Tradingview
--- written by James Stanley, Senior Market Analyst, Global Macro